Sideways Trend Analysis - NEPSE Market Update
Author
NEPSE TRADING
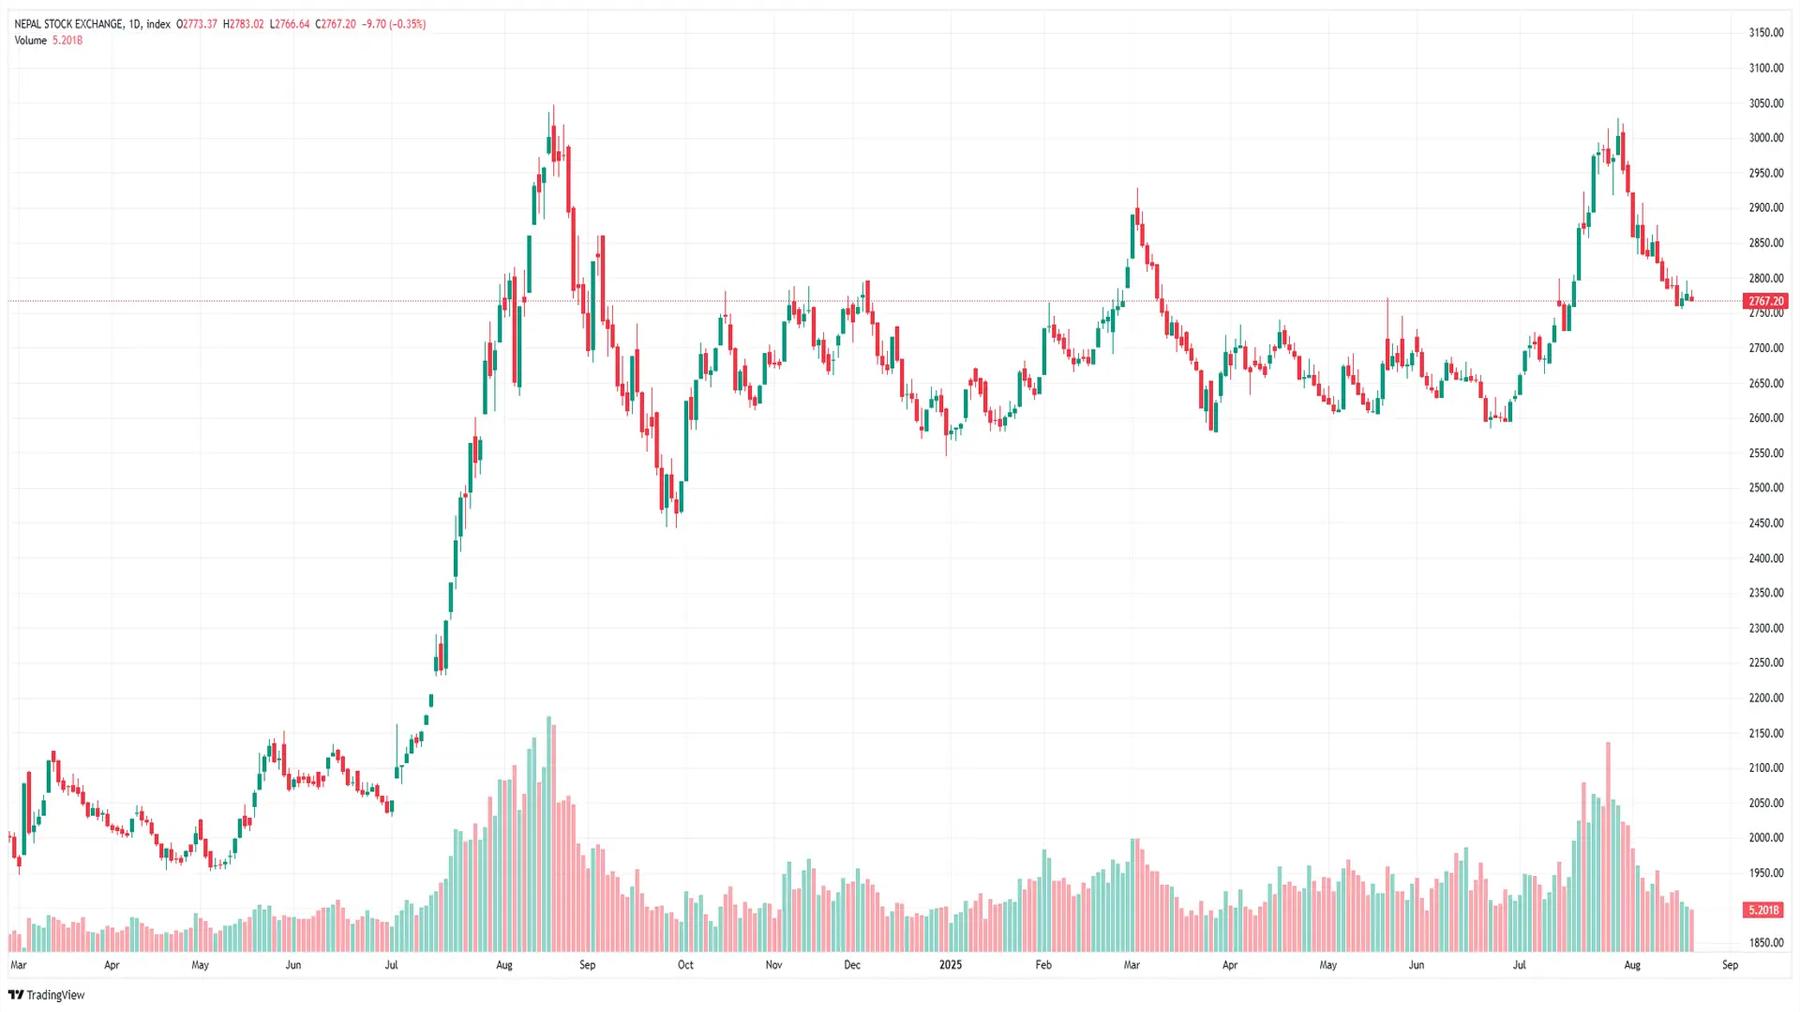
On Wednesday, the Nepal Stock Exchange (NEPSE) index closed lower, shedding 9.70 points to reach 2767.20. This comes after two consecutive days of positive growth. The Sensitive Index also dropped by 2.10 points, while the Float Index and Sensitive Float Index saw declines of 0.68 points and 0.72 points, respectively. These movements indicate some bearish pressure in the market.
There was also a drop in trading volume. On the previous day, shares worth NPR 5.63 billion were traded, but on Wednesday, the market saw a turnover of NPR 5.20 billion with 323 stocks and 53,853 transactions, amounting to 1.52 million shares being traded. Among the notable stocks, Development Hydropower's shares saw a positive surge, closing at NPR 321.30, up by NPR 29.20. Similarly, Chandragiri Hills witnessed a 7.5% rise in its stock price, while KB L Debenture 2086 saw a gain of over 7%. Panchakanya My Hydropower’s stock price, however, declined by 9.03%.
In terms of trading volume, Nepal Reinsurance Company topped the charts, with a turnover of NPR 250.9 million. Himalayan Reinsurance followed closely with over NPR 210 million in trade.
Analyzing the market by sectors, out of the 13 sub-sectors, 2 showed an increase, while 11 saw a decline. The Hotel & Tourism and Mutual Fund sub-sectors experienced a rise, with Hotel & Tourism seeing an increase of 2.03%, whereas the Trading sub-sector declined by 1.06%.
Technical Analysis: Sideways Trend
Today’s market behavior displayed a sideways trend, with the NEPSE index testing key support levels. According to stock analyst Ajit Khanal, the market reached and closed near the 50-day Moving Average and the 61% Fibonacci retracement level, which indicates the market's stability. If this support level holds, neither the positive nor negative market bias will be very strong.
Despite attempts to break the previous day's high, the market did not succeed. Instead, it broke down below the low of the previous day, showing a bearish tendency. However, the market ended with a sideways movement, confirming the support at the 50-day moving average and 61% Fibonacci retracement.
From a candlestick analysis perspective, both buyers and sellers showed weaker activity, which was also confirmed by the turnover. This zone is termed an "accumulation zone," where investors can build their portfolios with lower risks, according to analysts.
In sector-specific trading, the Hydro Power sector saw a decline in its share of trading volume, while the 'Others' and Manufacturing sectors gained in market share. A look at the top 10 brokers reveals a balanced buy-sell ratio of 5:5.