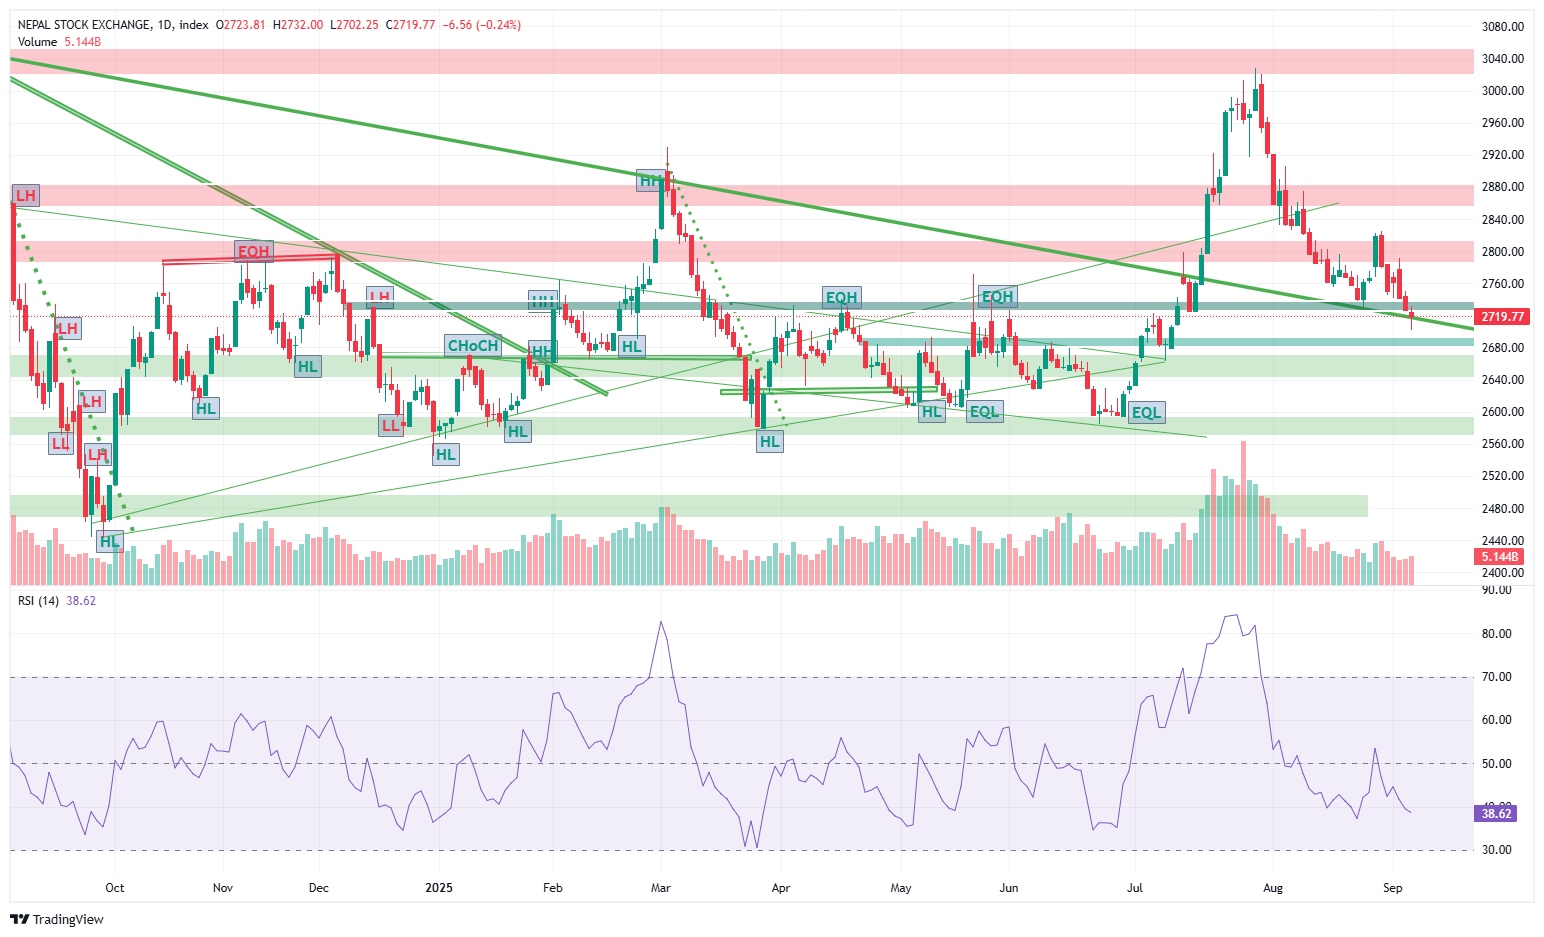
NEPSE Index Ends the Week in Decline, RSI is at 38.62
Author
NEPSE TRADING

Kathmandu – The NEPSE Index closed at 2,719.77 points at the end of this week, dropping by 61.23 points (2.20%) compared to last week’s close of 2,781 points.
Highs, Lows, and Turnover
Throughout the week, the index touched a high of 2,791.67 points and a low of 2,702.25 points, showing a weekly volatility of 89.42 points. In the previous week, volatility was slightly higher at 94.11 points.
The sharpest intraday loss came on Sunday, with the index falling by 31.71 points, while the turnover stood at Rs 6.06 Arba. The total weekly turnover amounted to Rs 25.47 Arba.
Technical Indicators
On the daily chart, the Relative Strength Index (RSI) is at 38.62, while on the weekly chart, it stands at 49.07, reflecting weaker market momentum.
Meanwhile, the MACD reading is at -21.32, with both the MACD and Signal lines in the negative zone, indicating ongoing bearish pressure.
The NEPSE Index also remains below both the 20-day Exponential Moving Average (EMA) and the 5-day EMA. Closing below shorter-term averages signals early bearish sentiment in the market.
Support and Resistance Levels
Analysts expect the 2,700 – 2,680 range to act as the nearest support zone, while the 2,860 – 2,820 range is likely to serve as a major resistance zone.
the market showed pressure and weakness this week. The index’s ability to hold around the 2,700 support level in the coming days will be crucial in determining the next market direction.