By Sandeep Chaudhary
Financial Analysis of NABIL Bank: A Comprehensive Review Q3 2080/2081
Date: June 7, 2024
In the latest financial update, NABIL Bank's performance metrics have demonstrated notable trends and patterns that provide insights into the bank's operational health and strategic positioning. Here is a detailed analysis of the key financial indicators for the quarters from Q3 2076/2077 to Q3 2080/2081.
Earnings Performance
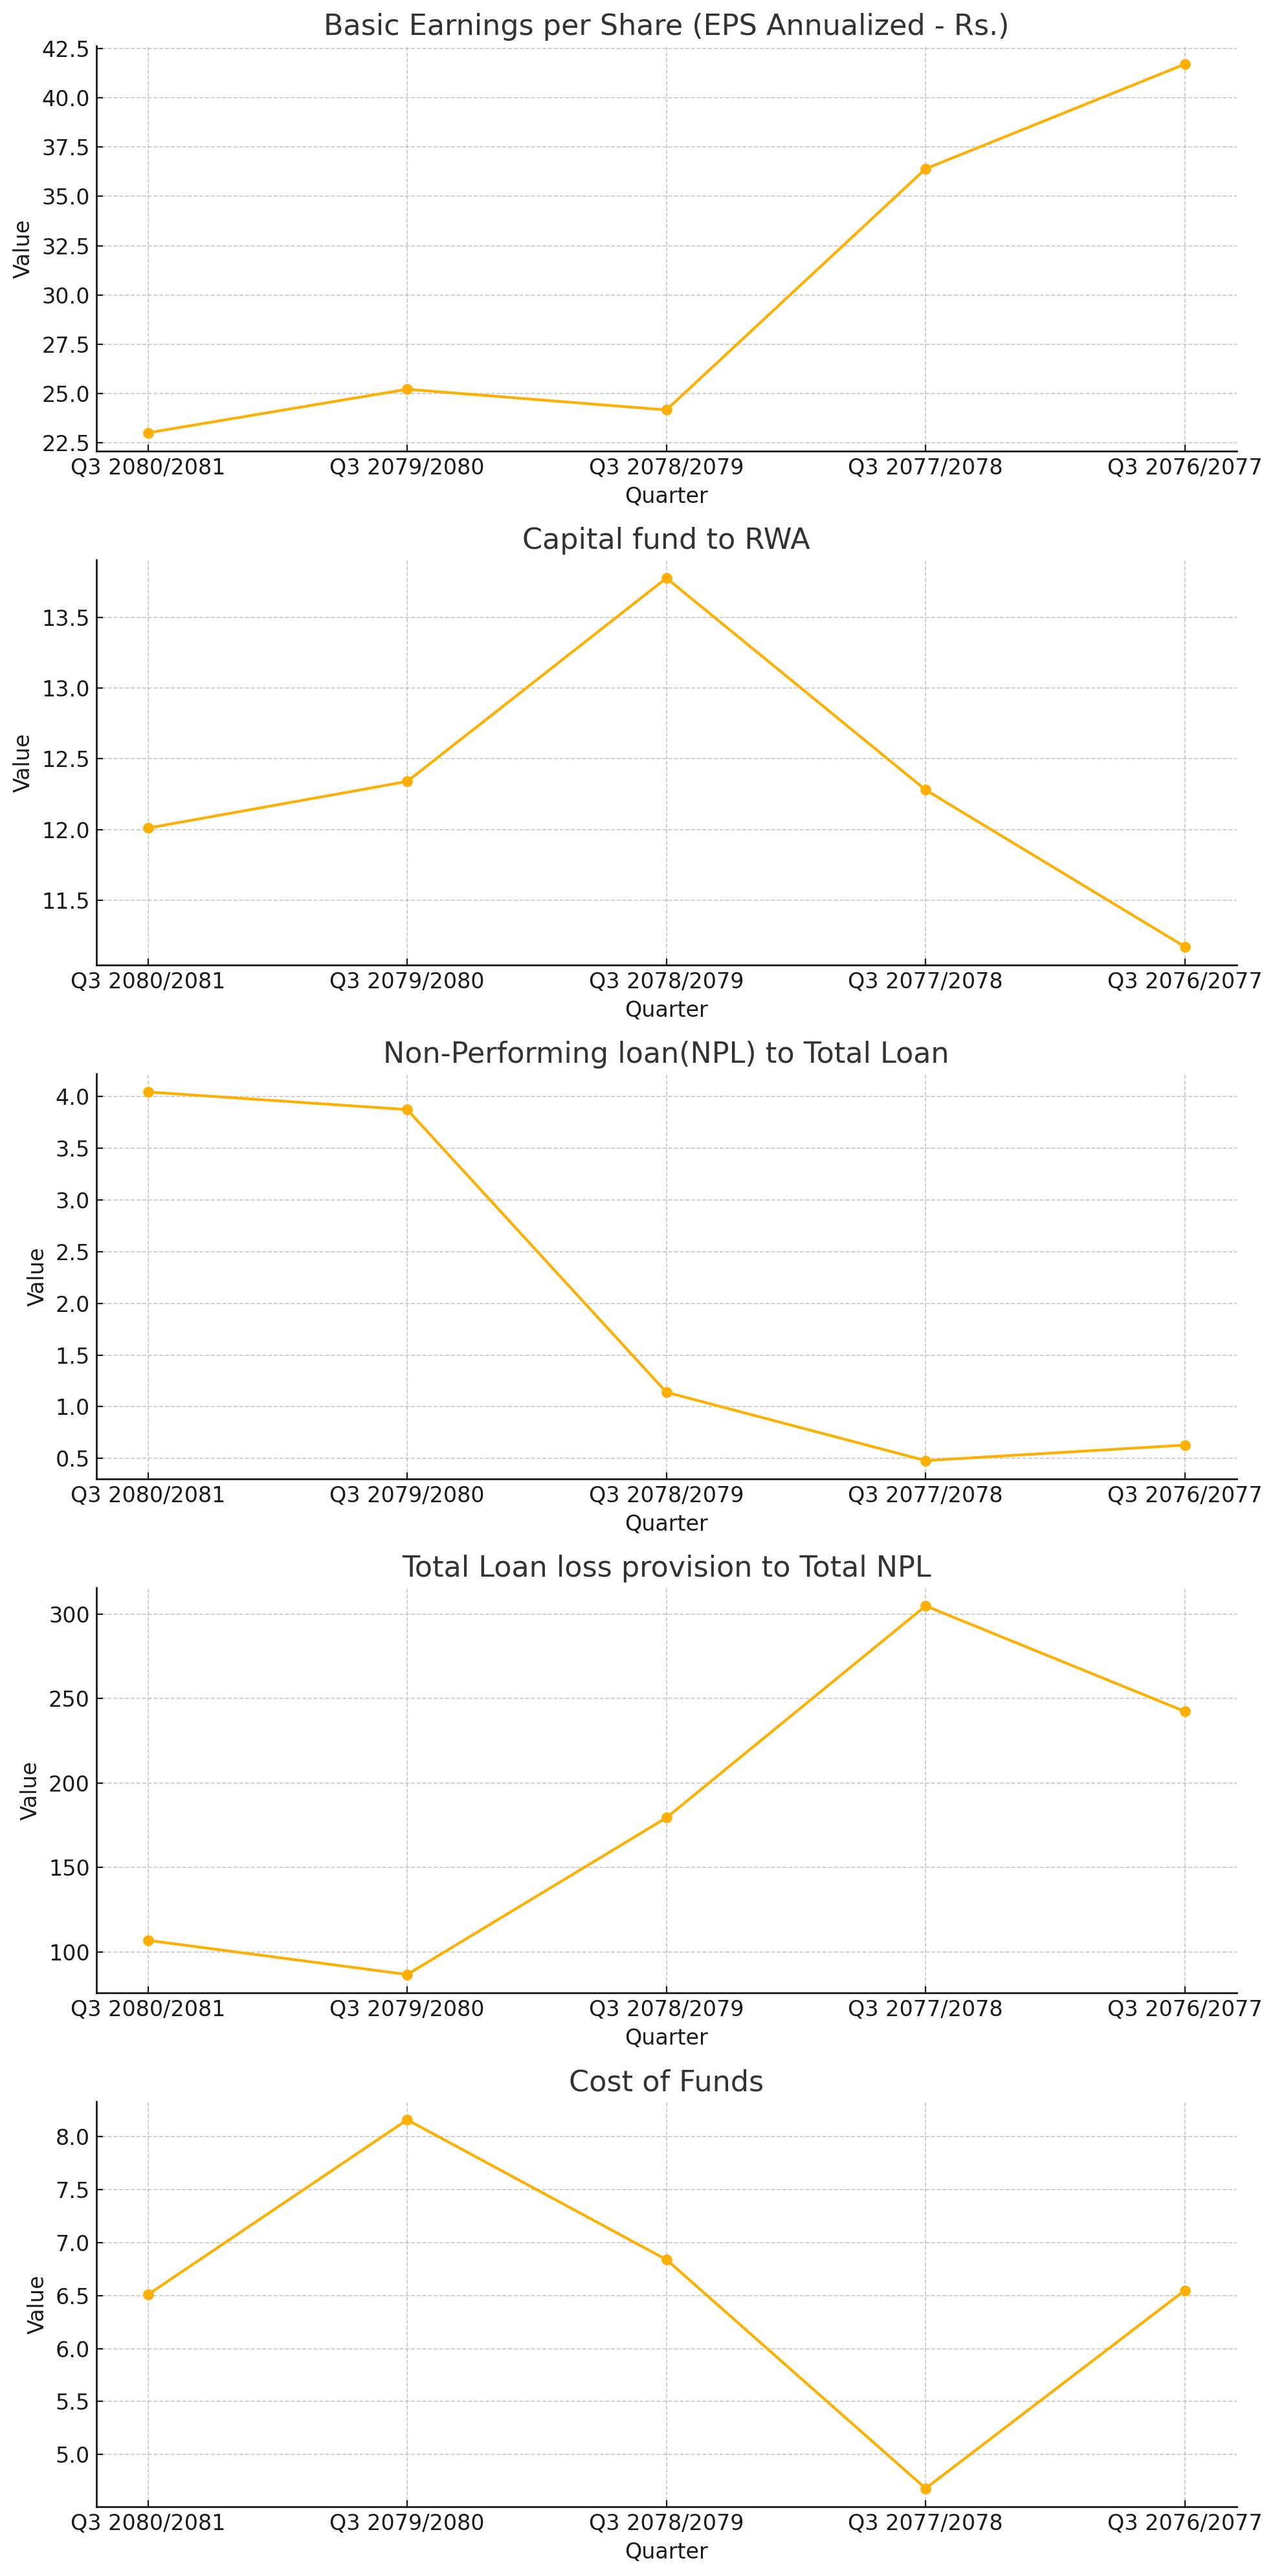
Basic Earnings per Share (EPS Annualized - Rs.): NABIL Bank's Basic EPS has shown a declining trend from Rs. 41.71 in Q3 2076/2077 to Rs. 23 in Q3 2080/2081. The consistent drop in EPS reflects challenges in maintaining profit levels amidst changing economic conditions. The drop in EPS indicates the bank might be facing pressure on its profit margins, possibly due to increased competition or higher operating costs.
Capital Adequacy and Asset Quality
Capital Fund to RWA: The Capital Fund to Risk-Weighted Assets (RWA) ratio has remained fairly stable, with a slight dip from 13.78% in Q3 2078/2079 to 12.01% in Q3 2080/2081. This indicates that NABIL Bank maintains a solid capital base, ensuring it can cover its risk-weighted assets adequately.
Non-Performing Loans (NPL) to Total Loan: NABIL has experienced a concerning increase in the NPL ratio, reaching 4.04% in Q3 2080/2081 from a low of 0.48% in Q3 2077/2078. This uptick signals potential issues in credit quality and loan performance, which could affect the bank's profitability and financial stability if not addressed promptly.
Total Loan Loss Provision to Total NPL: The provision coverage ratio has shown resilience, maintaining high levels with a peak of 304.82% in Q3 2077/2078 and 106.9% in the latest quarter. This robust coverage demonstrates NABIL's proactive approach in provisioning for potential loan losses, thereby safeguarding its financial health.
Cost Efficiency and Profitability
Cost of Funds: The Cost of Funds has fluctuated, peaking at 8.16% in Q3 2079/2080 before settling at 6.51% in Q3 2080/2081. Efficient management of funding costs is crucial for maintaining profit margins, especially in a competitive banking environment.
Credit to Deposit Ratio: NABIL's Credit to Deposit Ratio has decreased to 83.97% in Q3 2080/2081 from a high of 91.47% in Q3 2078/2079. This decline could indicate a more conservative lending approach or challenges in expanding the loan book relative to deposits.
Interest Rate and Shareholder Value
Base Rate and Interest Spread Rate: The Base Rate has decreased from 9.99% in Q3 2079/2080 to 8.36% in the latest quarter, while the Interest Spread Rate has narrowed to 4% from a peak of 5.15%. These metrics highlight the impact of macroeconomic factors on the bank's lending and borrowing rates, influencing overall profitability.
Total Shareholder's Equity: The Total Shareholder's Equity has shown a steady increase, reaching Rs. 56,384,591,000 in Q3 2080/2081. This growth in equity is a positive sign, reflecting the bank's ability to generate and retain earnings, thus enhancing shareholder value.
Profitability Ratios
Return on Equity (ROE) and Return on Assets (ROA): Both ROE and ROA have exhibited fluctuations, with ROE standing at 11.04% and ROA at 1.17% in Q3 2080/2081. These ratios underscore the bank's efficiency in utilizing its equity and assets to generate profits, though recent declines indicate room for improvement in operational efficiency.
Price to Earning Ratio (PE ratio - times): The PE ratio has declined to 19.04 times in Q3 2080/2081 from a high of 40.18 times in Q3 2078/2079. A lower PE ratio might suggest that the stock is undervalued relative to its earnings, presenting a potential opportunity for investors.
Distributable Profit: Distributable Profit for the year has significantly dropped to Rs. 1,547,086,000 in Q3 2080/2081 from Rs. 3,802,495,000 in Q3 2077/2078. Similarly, Distributable Profit per Share has decreased to Rs. 5.72, indicating challenges in maintaining high profit distribution levels.
Conclusion
NABIL Bank's financial performance over the analyzed quarters presents a mixed picture. While the bank has maintained strong capital adequacy and provision coverage, challenges such as rising non-performing loans and fluctuating profitability ratios suggest areas that need strategic focus. Stakeholders should closely monitor these trends to make informed decisions regarding the bank's future prospects.
NABIL Bank remains a resilient player in the banking sector, with opportunities for growth and improvement in the face of evolving market dynamics.
SWOT analysis for the data provided in the table, we need to consider the following aspects:
Strengths
Earnings Consistency: Despite fluctuations, NABIL has maintained a relatively consistent earnings per share (EPS) over the years, indicating stable profitability.
Capital Adequacy: The Capital fund to RWA ratio remains strong, which implies that the bank has sufficient capital to cover its risk-weighted assets.
Low Non-Performing Loans (NPLs): The NPL to Total Loan ratio is relatively low, indicating good asset quality and effective credit risk management.
Provision Coverage: The Total Loan loss provision to Total NPL ratio is high, showing that the bank has made substantial provisions to cover potential loan losses.
Shareholder’s Equity Growth: There is a steady increase in Total Shareholder’s Equity, indicating strong financial health and capacity to absorb losses.
ROE and ROA Stability: The Return on Equity (ROE) and Return on Assets (ROA) percentages are stable, reflecting efficient use of equity and assets to generate profits.
Net Worth per Share: A steady Net Worth per Share signifies that the bank is consistently adding value to its shareholders.
Weaknesses
Decreasing Earnings Per Share: There is a noticeable decline in Basic EPS and Diluted EPS from the peak years, which could be a concern for investors.
Increasing Non-Performing Loans: A slight increase in the NPL ratio in recent years may indicate potential credit quality issues.
Fluctuating Cost of Funds: The Cost of Funds has seen significant changes, impacting the bank's profitability margins.
Decreasing Interest Spread Rate: A decrease in the Interest Spread Rate over the years can affect the bank’s net interest margin and profitability.
High PE Ratios: The high Price to Earnings (PE) ratios in some years might indicate that the stock is overvalued.
Opportunities
Market Expansion: With increasing Total Shareholder’s Equity and a growing number of outstanding shares, NABIL is well-positioned to expand its market presence.
Technological Advancements: Investing in digital banking and technology can improve operational efficiency and customer experience.
New Revenue Streams: Exploring new financial products and services can create additional revenue streams.
Regulatory Changes: Favorable changes in banking regulations could provide growth opportunities.
Improving Macroeconomic Conditions: Positive economic trends can enhance overall banking sector performance.
Threats
Economic Downturn: Economic instability can lead to increased loan defaults and deteriorate the bank’s asset quality.
Regulatory Risks: Changes in banking regulations and compliance requirements can impact operational flexibility.
Market Competition: Increasing competition in the banking sector could pressure margins and market share.
Interest Rate Fluctuations: Variability in interest rates can impact the bank’s interest income and spread.
Operational Risks: Risks related to cyber security, fraud, and operational failures can affect the bank’s reputation and financial performance.
