By Sandeep Chaudhary
Imports from China See Double-Digit Growth Across Key Sectors
Nepal’s imports from China have registered robust growth, with the first eleven months of fiscal year 2024/25 recording a 15.3% increase compared to the same period last year, as total imports surged to Rs. 314.58 billion. This expansion marks continued dependency on Chinese goods across electronics, apparel, industrial materials, and daily consumer products.
The major commodity segment, which accounts for over two-thirds of the total import volume, rose by 17.5% to Rs. 208.19 billion. This was led by significant increases in items such as garlic (up 253%), steel rods and sheets (230%), solar panels (138.5%), and PVC compounds (153.4%). These figures indicate an uptick in construction-related and renewable energy investments.
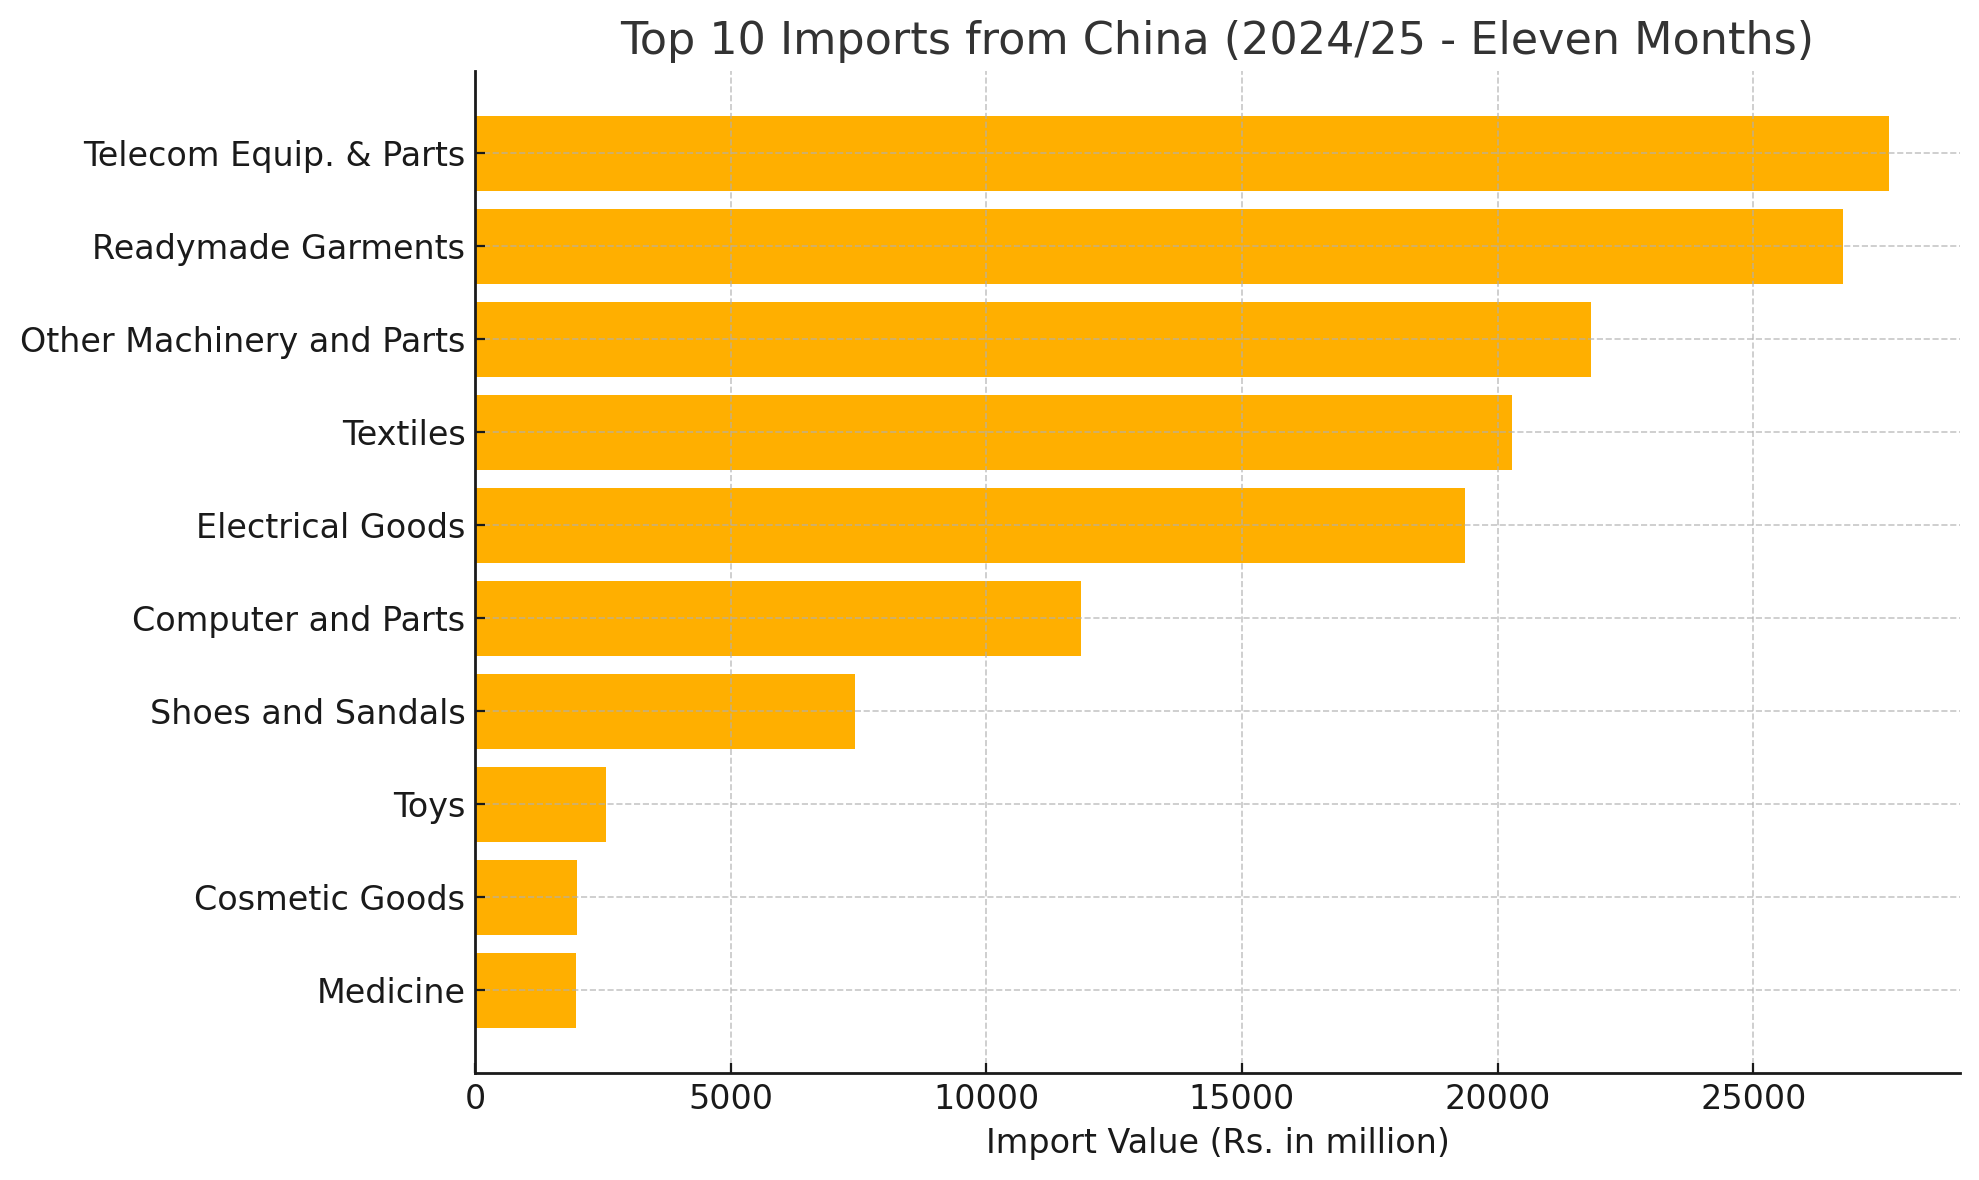
Consumer goods also contributed to the import surge. Imports of readymade garments increased by 22.3%, reaching Rs. 26.76 billion, while cosmetics rose by 16.1%. Imports of shoes and sandals, although slightly lower by 3.7%, remained high at Rs. 7.42 billion. Mobile accessories and smart cards saw a major decline, with smart card imports falling by 36.8%.
In the food category, imports of garlic skyrocketed to Rs. 6.57 billion—over three times the previous year’s value—suggesting heavy domestic reliance on Chinese supply for this staple. Conversely, imports of wheat products dropped by 31.5%, indicating possible shifts in food sourcing or lower demand.
Technology imports continued their steady climb. Computer and parts imports rose by 20.6% to Rs. 11.85 billion, while telecom equipment imports edged up 15.9% to Rs. 27.66 billion, reflecting increasing digitization across sectors. Electrical goods, valued at Rs. 19.36 billion, were up 27.9% year-on-year.
However, some traditional categories saw significant declines. For instance, metal and wooden furniture imports declined by 34%, and writing and printing paper imports halved. These shifts may reflect changes in local production capacity or consumption trends.
The “Others” category also posted a notable rise of 11.3%, indicating increased imports of miscellaneous items not categorized under the top 46 groups.
Overall, the consistent double-digit growth highlights Nepal’s continued trade reliance on China, especially for industrial inputs and consumer goods. The surges in solar panels, steel, and construction materials align with infrastructure growth and policy focus on energy diversification. However, heavy reliance on select food and tech imports also poses strategic and economic vulnerabilities.


