Employment
·

By Sandeep Chaudhary

Number of Nepalese Going for Foreign Employment as of 2023/24 (Nine-month Data)

Number of Nepalese Going for Foreign Employment as of 2023/24 (Nine-month Data)

Number of Nepalese going for Foreign Employment (Countrywise)" provides data on the annual and nine-month figures for foreign employment of Nepalese people across different countries for the years 2021/22, 2022/23, and 2023/24. Here is a detailed interpretation of the data:

Summary of Data

  • Countries Listed: 19 specific countries along with an 'Other' category.

  • Years:

    • 2021/22 (Annual and Nine Months)

    • 2022/23 (Annual and Nine Months)

    • 2023/24 (Nine Months)

  • Metrics:

    • Number of Nepalese going for foreign employment annually and for nine months.

    • Percent Share of foreign employment for nine months in 2022/23 and 2023/24.

    • Percent Change during nine months from 2022/23 to 2023/24.

Key Points

  1. Top Destination Countries (2023/24 Nine Months):

    • UAE: 91,695 (27.8% share, 131.1% increase from 2022/23 nine months).

    • Saudi Arabia: 53,561 (16.3% share, 35.2% increase from 2022/23 nine months).

    • Qatar: 31,501 (9.6% share, -0.9% change from 2022/23 nine months).

    • Malaysia: 99,959 (18.2% share, -68.0% change from 2022/23 nine months).

  2. Significant Changes:

    • Romania: 203.7% increase from 2022/23 nine months.

    • Turkey: -87.0% decrease from 2022/23 nine months.

    • Japan: 101.8% increase from 2022/23 nine months.

    • Israel: -92.8% decrease from 2022/23 nine months.

    • Other: 185.6% increase from 2022/23 nine months.

  3. Countries with Decreases:

    • Saudi Arabia: 63.5% decrease from 2022/23 nine months.

    • Qatar: 49.7% decrease from 2022/23 nine months.

    • Oman: 2.9% decrease from 2022/23 nine months.

  4. Total Numbers:

    • For nine months of 2023/24: 329,422 (15.1% decrease from 2022/23 nine months).

    • For nine months of 2022/23: 387,839.

Observations

  • UAE and Saudi Arabia are consistently among the top destinations for Nepalese seeking foreign employment.

  • Malaysia shows a significant drop in the number of Nepalese workers from 2022/23 to 2023/24.

  • Some countries like Romania and Japan are showing substantial growth, indicating emerging destinations for Nepalese workers.

  • The overall total for nine months of 2023/24 shows a decrease compared to 2022/23, suggesting a decline in foreign employment during this period.

This data can be crucial for policymakers to understand trends in foreign employment, identify emerging markets, and address any issues related to the decline or increase in specific regions.

Key Elements:

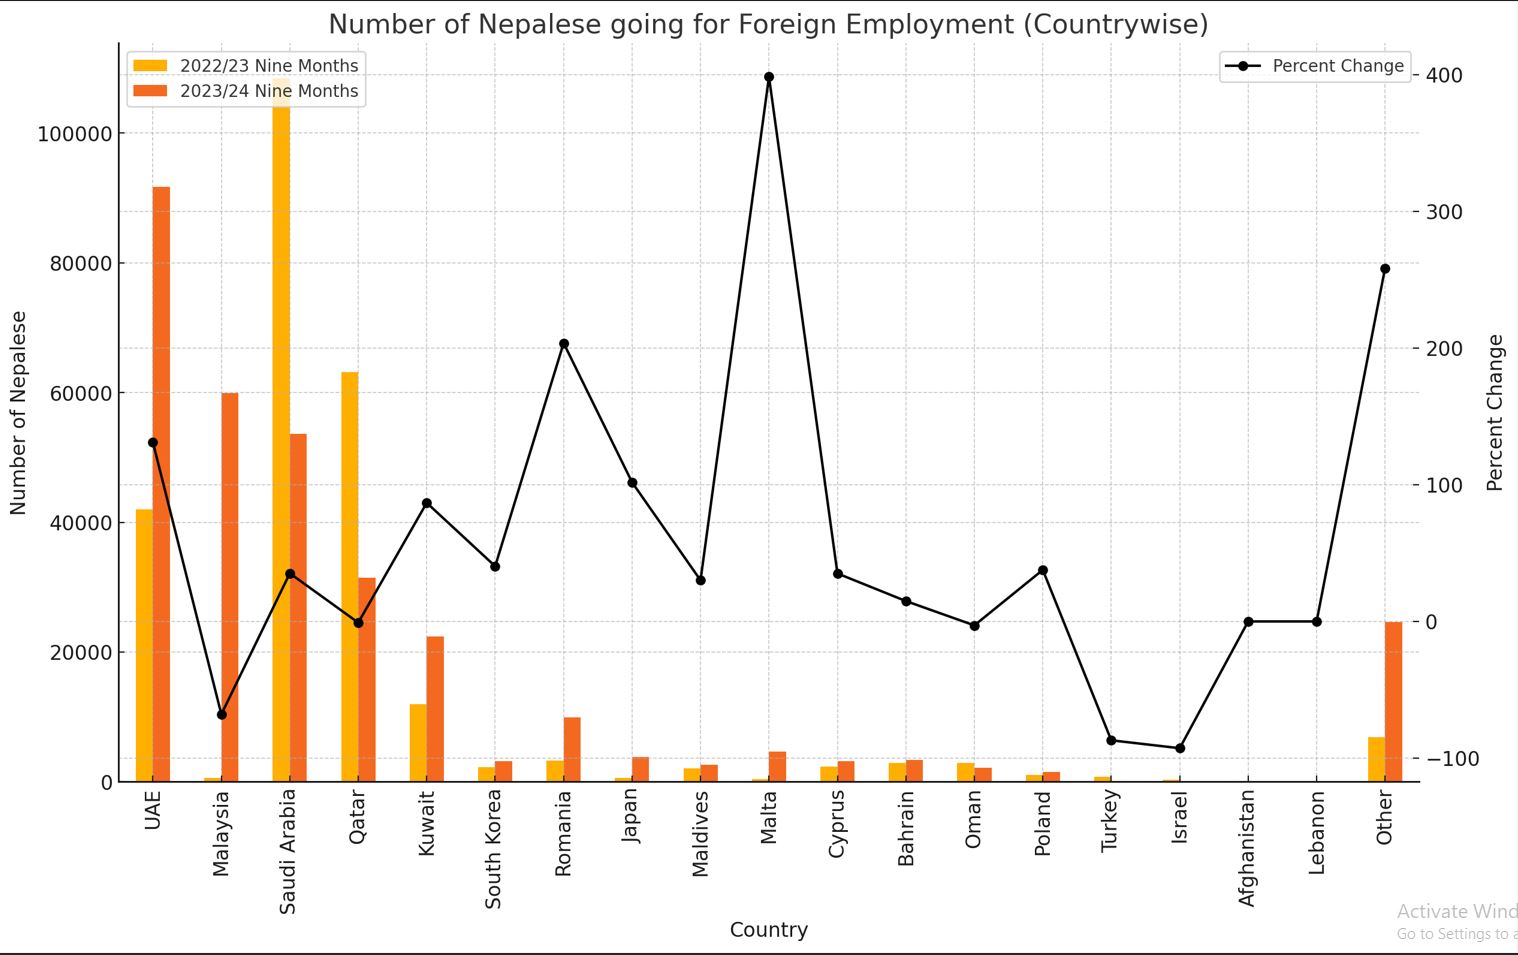
  • Bar Chart: Displays the number of Nepalese workers going for foreign employment in 2022/23 and 2023/24 (nine months) for each country.

  • Line Chart: Illustrates the percent change in the number of workers from 2022/23 to 2023/24 (nine months).

The chart above visually represents the number of Nepalese going for foreign employment to various countries during the nine months of 2022/23 and 2023/24.

Key Insights from the Chart:

  1. Number of Nepalese Workers:

    • UAE saw a significant increase from 41,963 in 2022/23 to 91,695 in 2023/24.

    • Malaysia and Saudi Arabia also show substantial numbers, though Malaysia had a notable decrease.

    • Qatar and Kuwait have stable or slightly varied figures.

    • Romania and Japan have sharp increases, indicating rising trends in these countries.

  2. Percent Change:

    • Romania, Japan, and Other categories show the highest positive percent changes, suggesting emerging or improving markets for Nepalese workers.

    • Malaysia, Turkey, and Israel exhibit significant negative changes, indicating a decline in Nepalese workers going to these countries.

The combination of bar charts for the number of workers and a line chart for percent change provides a comprehensive overview of trends in foreign employment for Nepalese across different countries

Related Blogs

Solar Energy in Nepal: Status, Potential, and Actionable Steps
Top

4 min read

Solar Energy in Nepal: Status, Potential, and Actionable Steps

"Nepal Budget 2082/83: Why Solar Energy Deserves a Bigger Push" "Solar Power in Nepal: Missed Opportunity and What the Budget Must Fix" "2082/83 Budget Priority: Solar Energy Policy Reforms & Investment Potential" "Nepal’s Untapped Solar Power: Budget Solutions for a Green Future" "Why Solar Energy Should Be a Budget Focus in Nepal 2082/83" "How Nepal’s Budget Can Unlock 400,000 MW Solar Potential" "Solar vs Hydro: Why the 2082/83 Budget Needs a Solar Boost" Solar Energy in Nepal: Missed Potential, Challenges & Way Forward Nepal holds immense potential for solar energy, receiving sunlight nearly 300 days a year, yet its utilization remains very low, with only 3.08% of total installed capacity coming from solar sources as of 2080. Though Nepal can generate over 400,000 MW using just 0.5% of its land, solar energy development is hindered by policy limitations, land use restrictions, equipment import dependence, and comparatively high Power Purchase Agreement (PPA) rates. 🔍 Key Highlights: Solar potential: Up to 429,000 MW using minimal land; 47 units/km²/day possible solar generation. World Bank estimate: 30,000 MW solar generation capacity in Nepal. Current share: Only 94.4 MW out of 3,060 MW total capacity is from solar (3.08%). Cost: Around NPR 6–7 crore per MW, with ROI in 7–8 years. Technology now allows grid connection without batteries. Land challenge: 1 MW needs about 20–25 ropanis; irrigation land banned for solar use. India’s benchmark: 1 MW solar plant costs only INR 5 crore, and PPA is INR 2/unit compared to Nepal’s NPR 5.94/unit. Legislation gap: Nepal’s new bill offers only 25 years for solar license, while hydro gets longer terms. Global context: India grew from 2,630 MW in 2014 to 84,277 MW in 2024. Targets 800,000 MW by 2030. Environmental impact: India saved 13.2 million tons of oil and reduced 61.3 million tons of CO₂ via solar energy growth. 🛠️ Suggested Actions: View solar as complementary to hydro, not a competitor. Utilize non-arable slopes and rooftops for installations. Offer rooftop solar grants and subsidies to households. Accelerate competitive PPAs, simplify land use laws, and extend license periods. Include solar expansion in the national budget strategy as a key area for green recovery, energy security, and rural access.

Dipesh Ghimire

·

26 May, 2025

Nepal Budget 2082/83: Hopes for Economic Recovery Amid Crisis
Top

6 min read

Nepal Budget 2082/83: Hopes for Economic Recovery Amid Crisis

"Nepal Budget 2082/83: Hopes for Economic Recovery Amid Crisis" "Full Analysis of Nepal Budget 2082/83: Debt, Deficit & Reform Expectations" "2082/83 Budget Explained: What to Expect from Nepal’s Economic Plan?" "Nepal Budget 2082/83: Challenges, Opportunities & Reform Roadmap" "What’s in Nepal’s FY 2082/83 Budget? Inflation, Trade Deficit & Growth Goals" "Nepal’s 2082/83 Budget Preview: Economic Stability or More Struggles?" "Breaking Down Nepal Budget 2082/83: Revenue, Spending & Structural Reform" Expectations from Nepal’s Fiscal Year 2082/83 Budget Nepal's economy is currently in a transitional crisis, and the upcoming Fiscal Year 2082/83 Budget is expected to play a critical role in economic recovery. With sluggish growth, declining private investment, underutilized capital expenditure, a rising trade deficit, and mounting public debt, the upcoming budget must go beyond numbers and become a reform-driven, actionable roadmap. 🔍 Key Highlights: Revenue collection has only reached 67% of the target so far; capital expenditure is at a poor 36%. The budget deficit has reached NPR 214 billion, and total public debt now exceeds NPR 2.622 trillion. Inflation is at 5.69%, while GDP growth remains stuck around 3%. The trade deficit hit NPR 1.256 trillion, nearly 7% higher than the same period last year. The government has released an Economic Reform Action Plan 2082 aimed at long-term structural reforms. Key goals include reducing interest rate spreads, repealing outdated laws, making government spending transparent, and stimulating investment in production, jobs, and infrastructure. Priority sectors include agriculture, MSMEs, tourism, energy, education, health, and digital economy. A results-oriented, transparent, and inclusive budget is a must to ensure sustainable growth and economic discipline.

Dipesh Ghimire

·

26 May, 2025