बजेटपछिको पहिलो कारोबारमै नेप्से २६ अंकले ओरालो, प्राविधिक सूचकहरूले पनि देखाए दिशाविहीनता NEPSE Plunges 26 Points in First Trading Day After Budget; Technical Indicators Point to Directionless Market
Dipesh Ghimire
काठमाडौं — आर्थिक वर्ष २०८३/८४ को बजेट आइसकेपछि पुँजी बजारले लिने दिशाबारे चासो बढेका बेला सोमबारको पहिलो कारोबार दिनले लगानीकर्तालाई निराश तुल्याएको छ । बजेटमा पुँजी बजारसँग जोडिएका थुप्रै लामो समयदेखिका मागलाई सम्बोधन गरिए पनि लगानीकर्ताको आत्मविश्वास उकासिन सकेन र नेप्से परिसूचक घाटामा बन्द भयो ।
सोमबार नेप्से परिसूचक २६.७२ अंकले घटेर २ हजार ७५५.७२ बिन्दुमा बन्द भएको छ । गत बिहीबारको कारोबारमा भने सूचक ४.९९ अंकले बढेको थियो । एक कारोबार दिनकै फरकमा देखिएको यो उतारचढावले बजारमा अझै स्थिरता नआएको संकेत गरेको छ ।
दिनभरको कारोबारमा ३४९ कम्पनीको १ करोड ३३ लाख ८३ हजार ८१६ कित्ता सेयर ६३ हजार ७१९ पटक हस्तान्तरण भयो । कुल कारोबार रकम ५ अर्ब ६१ करोड ४३ लाख ७४ हजार रुपैयाँ रह्यो । अघिल्लो कारोबार दिनको तुलनामा कारोबार रकम पनि खुम्चिएको छ, जसले बजारमा क्रयविक्रयको उत्साह घटेको देखाउँछ ।
मूल्य आन्दोलनतर्फ हेर्दा आज ३५ कम्पनीको सेयर मूल्य बढ्दा २३३ कम्पनीको घट्यो । समूहगत रूपमा हेर्दा दुई उपसमूहको परिसूचक मात्र हरियो भयो भने ११ उपसमूहको परिसूचक रातो रह्यो ।
बजेट सार्वजनिक हुनुअघि नै बजारका सरोकारवालाले यसपटकको बजेटलाई ‘बजार–मैत्री’ भनेर स्वागत गरेका थिए । पुँजीगत लाभकरलाई अन्तिम कर मान्ने घोषणा, गैरआवासीय नेपाली (एनआरएन) लाई दोस्रो बजारमा छिर्न दिने व्यवस्था, इन्ट्राडे कारोबार र डेरिभेटिभ उपकरणको तयारी तथा नेपाली कम्पनीलाई विदेशी बजारसम्म पुर्याउने ग्लोबल डिपोजिटरी रिसिट (जीडीआर) को व्यवस्थालाई लगानीकर्ताले सकारात्मक रूपमा लिएका थिए ।
तर बजेट आएलगत्तै आर्थिक विधेयकमा उल्लेख भएका प्रावधानले पुँजीगत लाभकर वास्तवमै अन्तिम कर हो कि होइन भन्नेमा नयाँ अन्योल जन्मायो । फलस्वरूप बजेटका सकारात्मक घोषणाभन्दा करको अन्योल र कार्यान्वयनको प्रश्न नै बजारमा हाबी भएको देखियो । विश्लेषकहरूका अनुसार बजेटमा पुँजी बजार सुधारका लागि संरचनागत रूपमा महत्त्वपूर्ण घोषणा भए पनि तिनको असर तत्कालै बजारमा देखिने अवस्था छैन । नेप्सेको पुनःसंरचना, सर्ट सेलिङ, इन्ट्राडे कारोबार, डेरिभेटिभ उपकरण, एनआरएन लगानी र जीडीआरजस्ता विषय कार्यान्वयनमा जान समय लाग्ने भएकाले लगानीकर्ताले तत्काल प्रतिफलभन्दा नीतिगत सुनिश्चितता खोजिरहेका छन् ।
बजेटले बैंकिङ क्षेत्रको बढ्दो खराब कर्जा व्यवस्थापन गर्न राष्ट्रिय सम्पत्ति व्यवस्थापन कम्पनी स्थापना गर्ने, नेपाल टेलिकम, राष्ट्रिय जीवन बीमा कम्पनी र विशाल बजार कम्पनीको सेयर निष्कासन प्रक्रिया अघि बढाउने तथा नेपाल धितोपत्र बोर्डको क्षमता अभिवृद्धि गर्ने घोषणासमेत गरेको छ । यी व्यवस्थालाई दीर्घकालीन रूपमा सकारात्मक मानिए पनि बजारले तत्काल भने भरोसा गरिसकेको छैन ।
सोमबारको कारोबारले लगानीकर्ता अझै ‘पर्ख र हेर’ को मनस्थितिमा रहेको देखाएको छ । बजेटमार्फत घोषणा भएका सुधारका कार्यक्रमको कार्यान्वयन, पुँजीगत लाभकरसम्बन्धी कानुनी स्पष्टता र आगामी मौद्रिक नीतिले नै बजारको दिशा निर्धारण गर्ने विश्लेषकहरूको आकलन छ । बजेटले सकारात्मक सन्देश दिने प्रयास गरे पनि पहिलो कारोबार दिनकै नतिजाले लगानीकर्ताको भरोसा पूर्ण रूपमा फर्किनसकेको छैन ।
कारोबार रकमका आधारमा आज आँखु खोला जलविद्युत कम्पनी शीर्ष स्थानमा रह्यो, जसको ४३ करोड ४ लाख रुपैयाँ बराबरको सेयर कारोबार भयो । त्यस्तै नेपाल रि–इन्स्योरेन्सको ३७ करोड रुपैयाँभन्दा बढी र हिमालयन रि–इन्स्योरेन्सको करिब २५ करोड ७७ लाख रुपैयाँको कारोबार भयो । रिडी पावरको पनि उल्लेखनीय कारोबार देखियो । मूल्यवृद्धितर्फ कालिञ्चोक हाइड्रोपावर र नेपाल रि–इन्स्योरेन्सको सेयर सकारात्मक सर्किटमा कारोबार भयो । उता बुंगल हाइड्रोपावरका लगानीकर्ताले भने सबैभन्दा बढी १३.२० प्रतिशतसम्मको गिरावट खेप्नुपर्यो ।
प्राविधिक विश्लेषण : दिशाविहीन र संकुचित दायराभित्र बजार
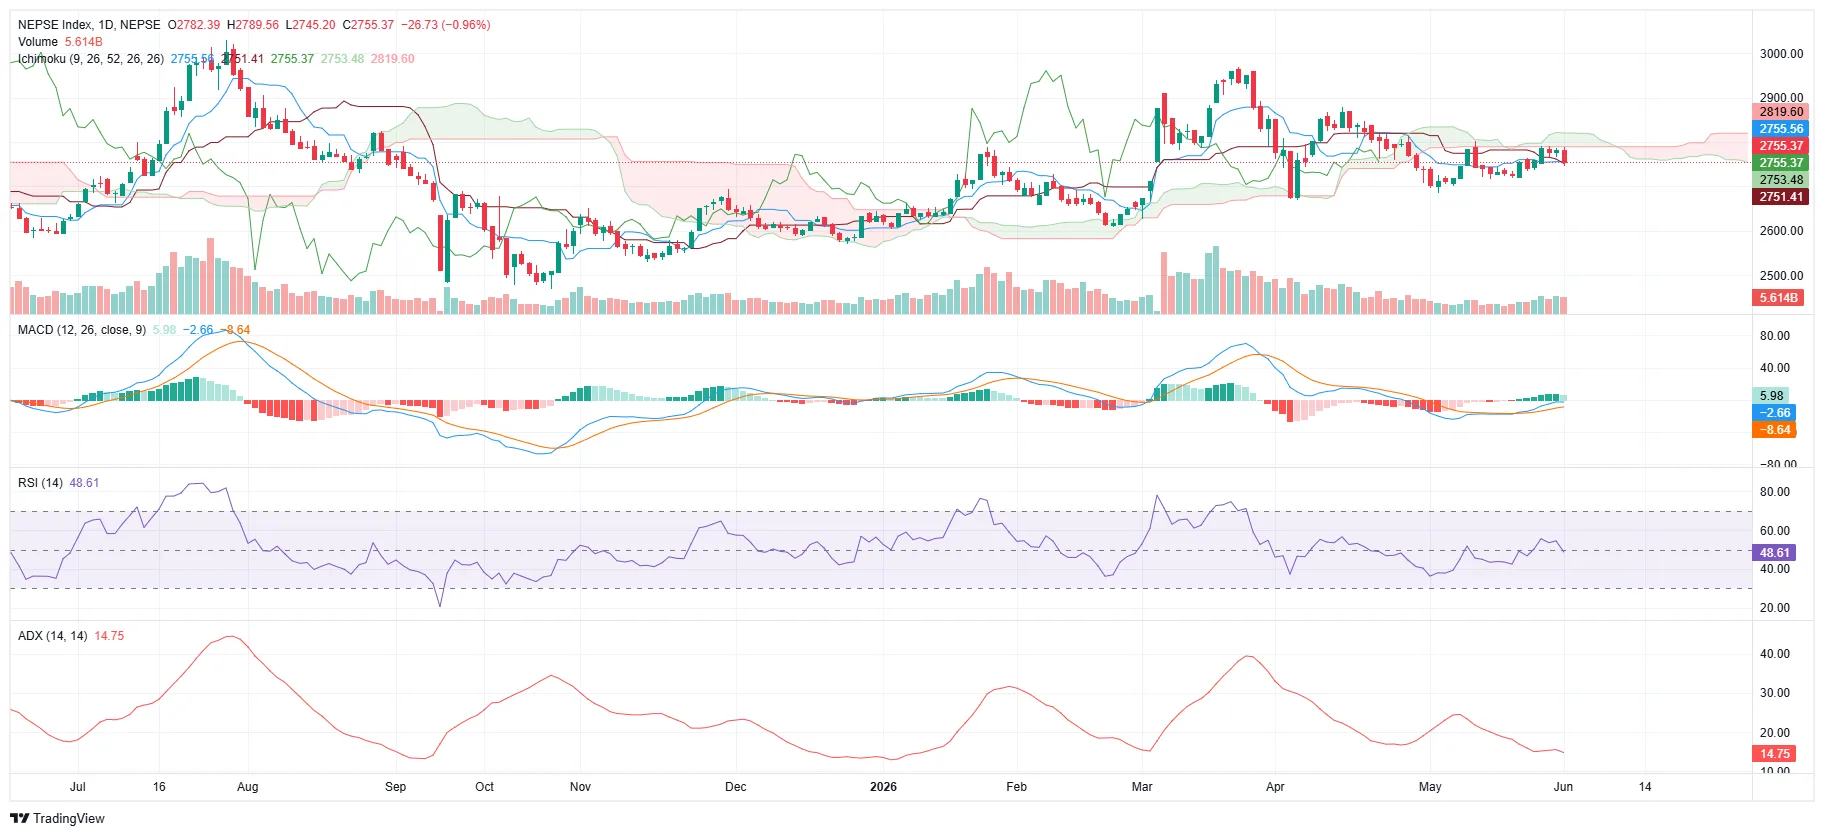
दैनिक (१ डे) चार्टमा आज बनेको क्यान्डल मध्यम आकारको रातो (बेयरिस) क्यान्डल हो । बजार माथिल्लो बिन्दुबाट खुलेर तल बन्द भएकाले यसले बिक्रीको दबाब हाबी रहेको देखाउँछ । क्यान्डलको माथिल्लो भागमा सानो छाया (अपर विक) र तल पनि केही छाया देखिनुले माथि चढ्ने प्रयास भएको तर त्यहाँ बिक्रेता सक्रिय भएर मूल्यलाई पछि धकेलेको संकेत मिल्छ । समग्रमा यो क्यान्डलले लगानीकर्ताबीच निर्णय गर्न नसकेको अनिर्णयको अवस्था (इनडिसिजन) र माथिल्लो तहमा प्रतिरोध रहेको झल्काउँछ ।
इचिमोकु इन्डिकेटरअनुसार बजार अहिले ‘क्लाउड’ (बादल) कै तल्लो किनारमा अड्किएको अवस्थामा छ । कन्भर्सन र बेस लाइन (२७५५ र २७५१ बिन्दु) नजिकै बन्द भएको परिसूचकमाथि करिब २ हजार ८१९ बिन्दुसम्म बादलको प्रतिरोध रहेको देखिन्छ । बजार बादलको तल वा छेउमा रहँदा यो स्पष्ट रूपमा बुलिस मानिन्न; बरु प्रवृत्ति अझै कमजोर र अनिश्चित रहेको संकेत गर्छ ।
एमएसीडी इन्डिकेटरमा एमएसीडी रेखा सिग्नल रेखाभन्दा माथि रहेको र हिस्टोग्राम सकारात्मक देखिएको छ । यसले अल्पकालमा मोमेन्टम केही सकारात्मक मोड लिँदै रहेको देखाए पनि दुवै रेखा अझै शून्य रेखाभन्दा तलै रहेकाले बजारको आधारभूत प्रवृत्ति अझै कमजोर नै रहेको पुष्टि हुन्छ । अर्थात् सुधारको प्रयास भइरहेको छ, तर बलियो तेजीको पुष्टि अझै आइसकेको छैन ।
आपेक्षिक शक्ति सूचक (आरएसआई) ४८.६१ मा रहेको छ, जुन मध्यरेखा ५० भन्दा सामान्य तलको अवस्था हो । यसले बजार न ओभरबट (अति किनिएको) न ओभरसोल्ड (अति बिकेको) अवस्थामा रहेको, बरु तटस्थ क्षेत्रमा रहेको देखाउँछ । यो तहले कुनै बलियो दिशा नदिई बजार दोधारमा रहेको पुनः पुष्टि गर्छ ।
ट्रेन्डको शक्ति नाप्ने एडीएक्स सूचक १४.७५ मा झरेको छ, जुन सामान्यतः मानिने २०–२५ को तहभन्दा निकै तल हो । यति न्यून एडीएक्सले बजारमा कुनै बलियो प्रवृत्ति (ट्रेन्ड) नभई परिसूचक दायरामै घुमिरहेको (साइडवे/रेन्जबाउन्ड) अवस्थालाई स्पष्ट पार्छ ।
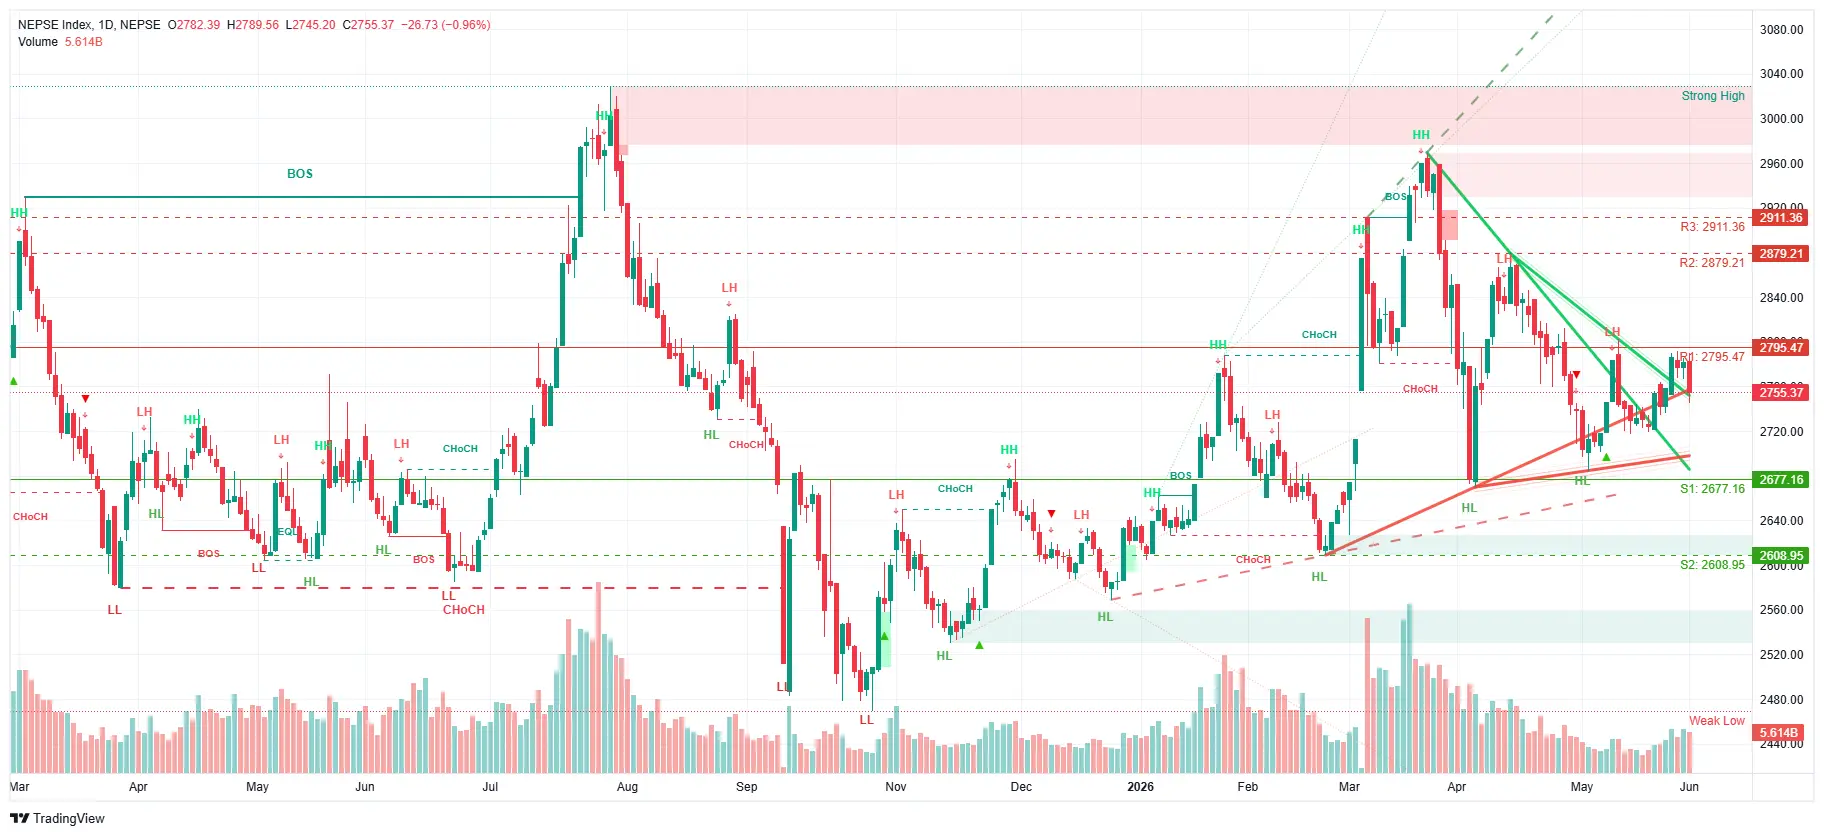
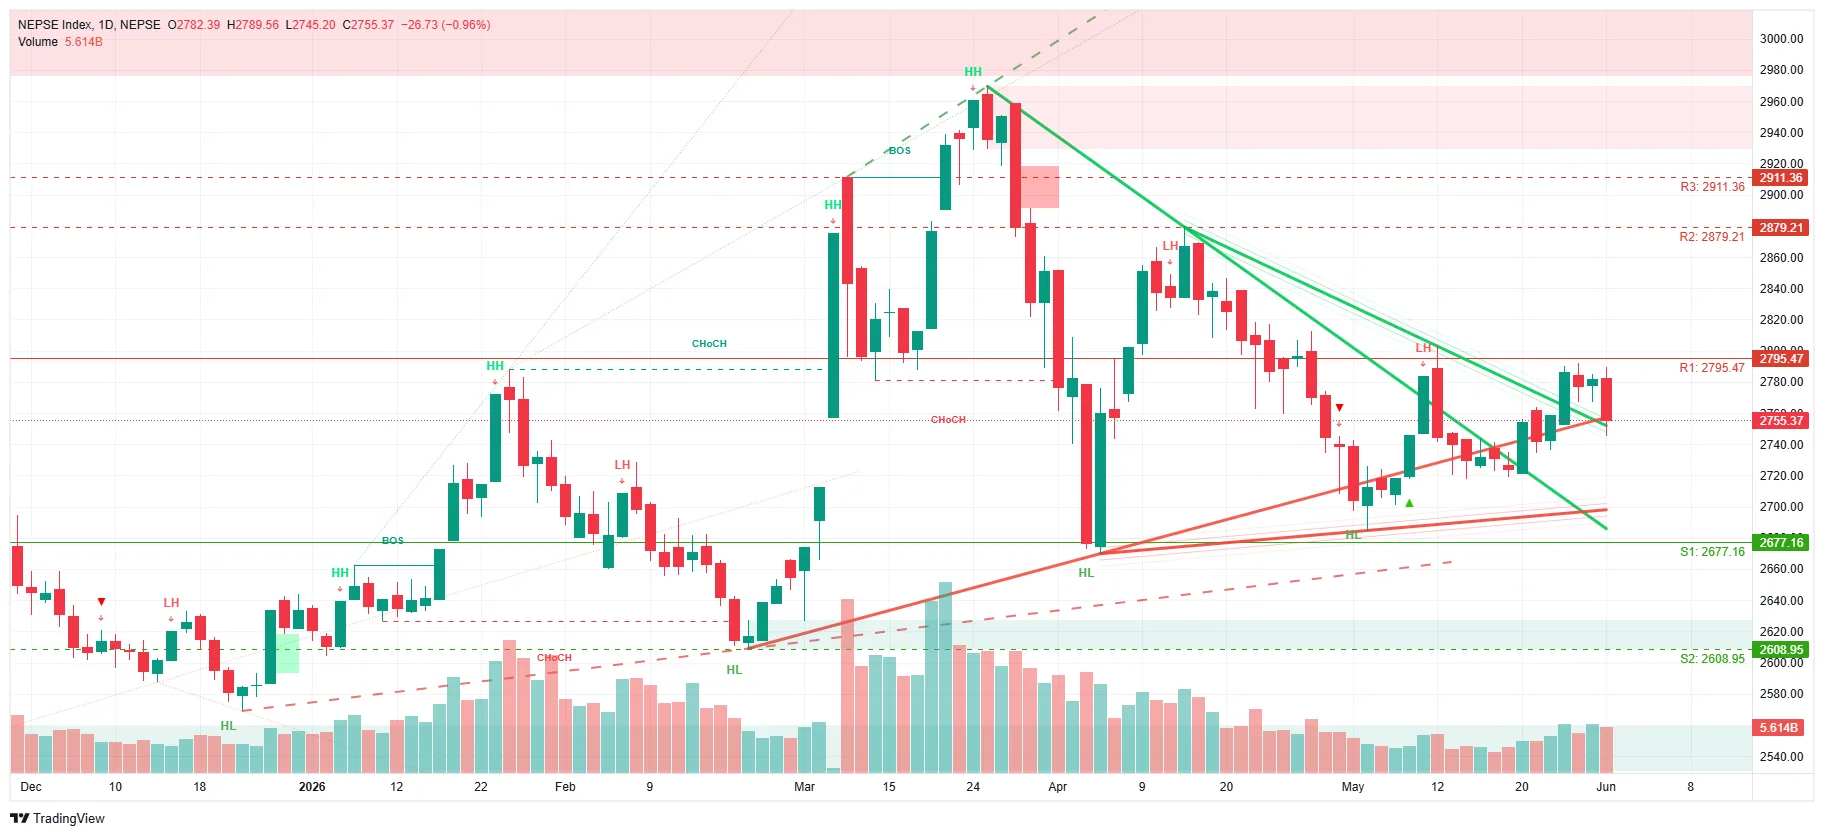
स्मार्ट मनी कन्सेप्ट (एसएमसी) सहितको चार्टले बजार एउटा संकुचित (कन्ट्र्याक्टिङ) त्रिकोणभित्र अड्किएको देखाउँछ । माथिबाट ओर्लंदै आएको प्रतिरोध रेखा र तलबाट उक्लँदै आएको सहारा रेखा एकआपसमा नजिकिँदै गएकाले बजार ‘ब्रेकआउट’ को नजिक पुगेको संकेत मिल्छ । चार्टमा पछिल्लो समय बनेको ‘लोअर हाई’ ले माथिल्लो तहमा बिक्रीको दबाब रहेको देखाएको छ । तत्कालका लागि माथिल्तिर पहिलो प्रतिरोध २ हजार ७९५.४७ बिन्दुमा छ भने त्यसपछि क्रमशः २ हजार ८७९.२१ र २ हजार ९११.३६ मा प्रतिरोध देखिन्छ । तलतिर भने पहिलो सपोर्ट २ हजार ६७७.१६ र दोस्रो २ हजार ६०८.९५ बिन्दुमा रहेको छ ।
समग्रमा प्राविधिक सूचकहरूले बजार अहिले कुनै स्पष्ट दिशाविहीन, तटस्थ र संकुचित दायराभित्र रहेको देखाएका छन् । एमएसीडीको सानो सकारात्मक मोड र आजको रातो क्यान्डलबीचको खिचातानीले अल्पकालमा अझै उतारचढाव कायमै रहन सक्ने संकेत गर्छ । प्राविधिक रूपमा बजारको अर्को बलियो चाल त्रिकोणको कुन दिशामा ‘ब्रेकआउट’ हुन्छ भन्नेमा निर्भर रहने देखिन्छ ।
०००
(द्रष्टव्य: प्राविधिक विश्लेषण खण्ड विशुद्ध चार्ट अध्ययनमा आधारित सूचनामूलक सामग्री हो, लगानी सल्लाह होइन ।)

Dipesh Ghimire
Kathmandu — As interest grew over the direction the capital market would take following the release of the budget for fiscal year 2083/84, the first trading day on Monday left investors disappointed. Although the budget addressed several long-standing demands related to the capital market, investor confidence failed to lift, and the NEPSE index closed in the red.
On Monday, the NEPSE index fell 26.72 points to close at 2,755.72. In the previous trading session last Thursday, the index had risen by 4.99 points. The swing seen within a single trading day signals that stability has yet to return to the market.
Over the course of the day, 1,33,83,816 units of shares of 349 companies changed hands across 63,719 transactions. The total turnover stood at Rs 5 arba 61 crore 43 lakh 74 thousand. Compared to the previous trading day, turnover also contracted, indicating a decline in buying and selling enthusiasm in the market.
On the price movement front, the share prices of 35 companies rose today while 233 declined. In group terms, the sub-indices of only two subgroups turned green, while those of 11 subgroups remained red.
Even before the budget was made public, market stakeholders had welcomed this year's budget as "market-friendly." Investors had viewed several provisions positively: the announcement to treat capital gains tax as a final tax, the arrangement allowing Non-Resident Nepalis (NRNs) to enter the secondary market, preparations for intraday trading and derivative instruments, and the provision for issuing Global Depository Receipts (GDRs) to extend Nepali companies' access to foreign markets.
However, immediately after the budget's release, provisions mentioned in the Finance Bill triggered fresh confusion over whether capital gains tax was, in fact, truly a final tax. As a result, rather than the budget's positive announcements, it was the tax-related uncertainty and the question of implementation that came to dominate the market. According to analysts, although the budget made structurally significant announcements aimed at capital market reform, their impact is not something that will be reflected in the market immediately. Since matters such as the restructuring of NEPSE, short selling, intraday trading, derivative instruments, NRN investment, and GDRs will take time to implement, investors are seeking policy certainty rather than immediate returns.
The budget also announced the establishment of a National Asset Management Company to manage the banking sector's rising bad loans, the advancement of the share issuance process for Nepal Telecom, Rastriya Beema Company (national life insurance), and Bishal Bazar Company, as well as enhancing the capacity of the Securities Board of Nepal. While these provisions are considered positive over the long term, the market has not yet placed its trust in them immediately.
Monday's trading showed that investors are still in a "wait and watch" frame of mind. Analysts assess that the implementation of the reform programs announced through the budget, legal clarity regarding capital gains tax, and the upcoming monetary policy will ultimately determine the market's direction. Although the budget attempted to send a positive message, the outcome of the very first trading day showed that investor confidence has not yet fully returned.
In terms of turnover, Aankhu Khola Hydropower Company topped the list today, with shares worth Rs 43 crore 4 lakh traded. Similarly, Nepal Reinsurance recorded turnover of more than Rs 37 crore, and Himalayan Reinsurance about Rs 25 crore 77 lakh. Ridi Power also saw notable turnover. On the gainers' side, shares of Kalinchowk Hydropower and Nepal Reinsurance traded at the positive circuit. Meanwhile, investors in Bungal Hydropower bore the steepest decline, of up to 13.20 percent.
Technical Analysis: Market Stuck in a Directionless, Contracting Range
On the daily (1D) chart, the candle formed today is a medium-sized red (bearish) candle. Since the market opened from a higher point and closed lower, it indicates that selling pressure dominated. The presence of a small upper shadow (upper wick) on the candle, along with some shadow below, suggests an attempt to climb higher, but with sellers becoming active there to push the price back. Overall, this candle reflects a state of indecision among investors and the presence of resistance at higher levels.
According to the Ichimoku indicator, the market is currently stuck at the lower edge of the "cloud." Having closed near the Conversion and Base lines (2,755 and 2,751 points), the index faces cloud resistance up to around 2,819 points above. When the market sits below or at the edge of the cloud, it is not clearly considered bullish; rather, it signals that the trend remains weak and uncertain.
In the MACD indicator, the MACD line is above the signal line, and the histogram appears positive. While this shows momentum taking a somewhat positive turn in the short term, since both lines remain below the zero line, it confirms that the market's underlying trend is still weak. In other words, an attempt at recovery is underway, but confirmation of a strong uptrend has not yet arrived.
The Relative Strength Index (RSI) stands at 48.61, which is a position slightly below the midline of 50. This shows that the market is neither overbought nor oversold, but rather sits in neutral territory. This level, by offering no strong direction, once again confirms that the market is in two minds.
The ADX indicator, which measures trend strength, has dropped to 14.75 — well below the commonly accepted level of 20–25. Such a low ADX makes clear a sideways/range-bound condition, in which there is no strong trend and the index is merely revolving within a range.
The chart with the Smart Money Concept (SMC) shows the market stuck within a contracting triangle. As the resistance line descending from above and the support line rising from below draw closer to one another, it signals that the market has approached a "breakout." The "lower high" formed recently on the chart shows the presence of selling pressure at higher levels. For now, on the upside, the first resistance lies at 2,795.47 points, followed by 2,879.21 and 2,911.36 respectively. On the downside, the first support is at 2,677.16 and the second at 2,608.95 points.
Overall, the technical indicators show the market currently to be directionless, neutral, and within a contracting range. The tug-of-war between MACD's small positive turn and today's red candle signals that fluctuations may persist in the short term. Technically, the market's next strong move appears to depend on which direction the triangle "breaks out."
(Note: The technical analysis section is informational material based purely on chart study, not investment advice.)