By Sandeep Chaudhary
Analysis of Major Commodity Imports in Nepal (2023/24): Share in Total Imports and Percent Change

Overview
The data provides a detailed overview of the imports of major commodities in Nepal over three time periods: the annual imports for the fiscal year 2021/22, annual imports for the fiscal year 2022/23, and imports for the first nine months of the fiscal year 2023/24. Additionally, it includes the share of each commodity in total imports and the percent change from the previous period.
Key Observations
Petroleum Products:
2021/22: 334,346.4 million NPR
2022/23: 309,877.0 million NPR
2023/24 (Nine Months): 213,782.5 million NPR
Share in Total Imports: 18.7%
Percent Change: -5.2%
Interpretation: Petroleum products remain the largest import category, accounting for 18.7% of total imports in the first nine months of 2023/24. There is a decline in imports by 5.2% compared to the previous period, indicating a possible reduction in petroleum consumption or a shift towards alternative energy sources.
Other Machinery and Parts:
2021/22: 91,571.3 million NPR
2022/23: 72,946.5 million NPR
2023/24 (Nine Months): 54,461.4 million NPR
Share in Total Imports: 4.7%
Percent Change: -24.4%
Interpretation: There is a significant decrease of 24.4% in the imports of other machinery and parts, possibly due to reduced industrial activity or improved local manufacturing capabilities.
Transport Equipment, Vehicle & Other Vehicle Spare Parts:
2021/22: 123,916.9 million NPR
2022/23: 61,799.8 million NPR
2023/24 (Nine Months): 54,702.8 million NPR
Share in Total Imports: 4.7%
Percent Change: 21.0%
Interpretation: This category saw a notable increase of 21.0% in imports, indicating a growing demand for transport equipment and vehicle spare parts, likely driven by an expanding automotive sector.
Medicine:
2021/22: 76,089.7 million NPR
2022/23: 47,658.4 million NPR
2023/24 (Nine Months): 42,138.4 million NPR
Share in Total Imports: 2.8%
Percent Change: -11.4%
Interpretation: There is a decline of 11.4% in medicine imports, which could be due to increased local production or changes in healthcare import policies.
Ferrous Products Obtained by Direct Reduction of Iron (Sponge Iron):
2021/22: 23,981.7 million NPR
2022/23: 43,601.8 million NPR
2023/24 (Nine Months): 30,637.1 million NPR
Share in Total Imports: 2.4%
Percent Change: -5.3%
Interpretation: Imports of sponge iron have decreased by 5.3%, reflecting fluctuations in the construction and manufacturing sectors.
Total Imports
Top 20 Commodities:
2021/22: 1,128,531.6 million NPR
2022/23: 961,201.2 million NPR
2023/24 (Nine Months): 663,954.9 million NPR
Percent Change: -8.0%
Interpretation: The top 20 commodities represent a significant portion of total imports, with an overall decrease of 8.0% in the first nine months of 2023/24, suggesting a tightening of import policies or economic slowdown.
Other Imports:
2021/22: 792,096.8 million NPR
2022/23: 650,530.6 million NPR
2023/24 (Nine Months): 503,414.9 million NPR
Percent Change: 4.9%
Interpretation: Other imports increased by 4.9%, indicating diversification in import categories beyond the top 20 commodities.
Total Imports:
2021/22: 1,920,448.4 million NPR
2022/23: 1,611,731.8 million NPR
2023/24 (Nine Months): 1,167,369.8 million NPR
Percent Change: -2.8%
Interpretation: The total imports show a slight decrease of 2.8%, reflecting changes in trade dynamics, possibly due to economic adjustments or global market conditions.
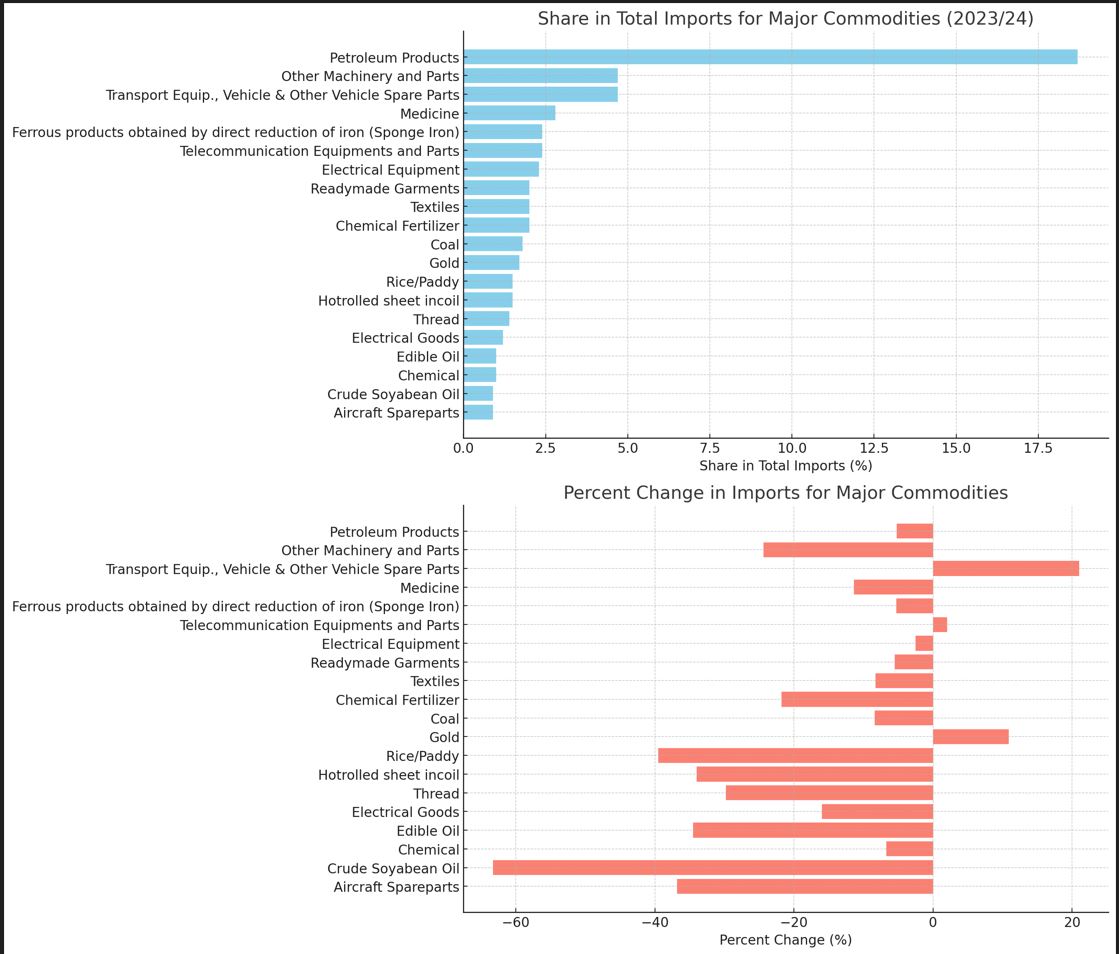
The charts above provide a visual representation of the data from the table regarding the imports of major commodities.

Share in Total Imports (2023/24)
This chart shows the percentage share of each commodity in the total imports for the first nine months of 2023/24:
Petroleum Products have the highest share at 18.7%, indicating their significant role in the import market.
Other notable commodities include Other Machinery and Parts and Transport Equipment, Vehicle & Other Vehicle Spare Parts, each with a 4.7% share.
Commodities like Medicine, Telecommunication Equipments and Parts, and Ferrous Products (Sponge Iron) also have notable shares.
Percent Change in Imports
This chart illustrates the percentage change in imports for each commodity compared to previous periods:
Transport Equipment, Vehicle & Other Vehicle Spare Parts showed a significant increase of 21.0%, reflecting growing demand.
Petroleum Products saw a decrease of 5.2%, which might be due to reduced consumption or a shift towards alternative energy sources.
Other Machinery and Parts experienced a substantial decline of 24.4%, potentially due to reduced industrial activity or increased local production.
Crude Soyabean Oil and Aircraft Spareparts experienced the largest decreases, at -63.3% and -36.8% respectively.
Interpretation Summary
The overall trend indicates a mix of increasing and decreasing imports across different commodities.
The data suggests a diversification in imports with significant reliance on petroleum products.
The variations in import changes highlight shifts in demand, local production capabilities, and possibly changes in trade policies or economic conditions.


