By Sandeep Chaudhary
Macroeconomic Indicators of Nepal: An In-Depth Analysis Based on Nine Months Data of 2023/24

Nepal's economy has exhibited varied trends over the recent years, marked by fluctuations in growth, inflation, trade, and financial indicators. This article delves into the key macroeconomic indicators from 2018/19 to 2023/24SS, providing a comprehensive overview of the country's economic health.
Real Sector (Growth and Ratio in Percent)
The real GDP at basic prices has seen a rollercoaster ride, from a low of -2.4% in 2019/20 due to the economic downturn, bouncing back to 3.5% in 2023/24SS. The real GDP at purchasers' prices followed a similar trend, stabilizing around 3.9% in 2023/24SS after peaking at 5.6% in 2021/22.
The gross national income (GNI) also exhibited growth, recovering from 0.8% in 2019/20 to 7.0% in 2023/24SS. Investments in fixed assets, indicated by gross fixed capital formation/GDP, showed fluctuations but increased to 30.5% in 2023/24SS. The gross domestic product (GDP) at current prices consistently rose, reaching NPR 5704.8 billion in 2023/24SS.
Prices Change (Percent)
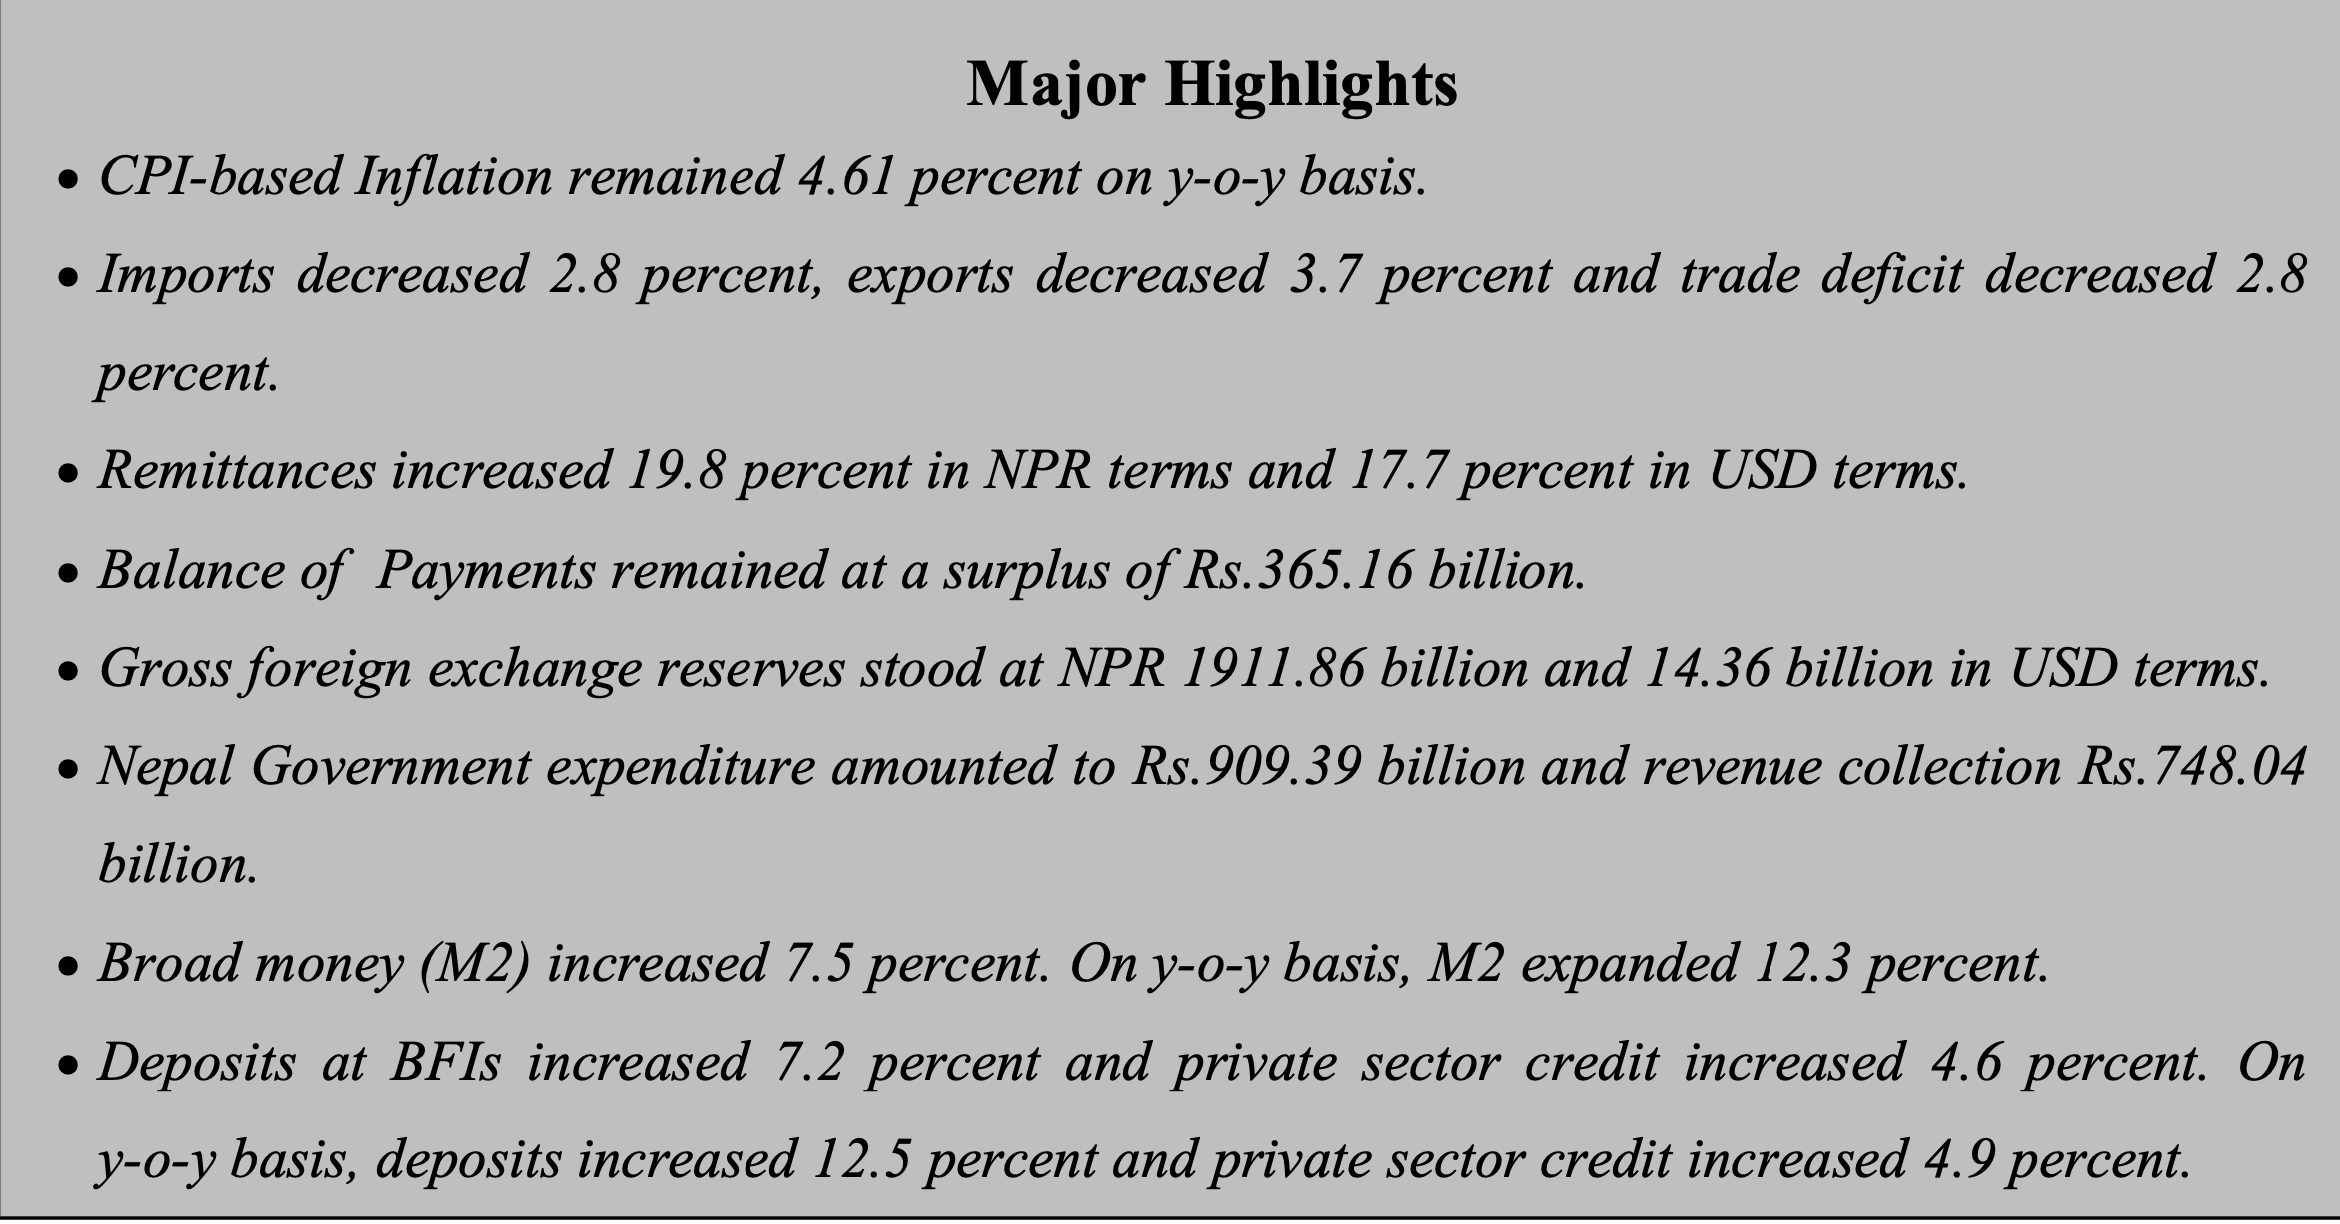
Inflation, measured by the Consumer Price Index (CPI), peaked at 8.08% in 2021/22 before dropping to 4.61% in 2023/24 (Mid-April). The National Wholesale Price Index showed significant variability, with a notable peak of 12.74% in 2021/22. The Salary and Wage Rate Index also saw a steady increase, reaching 10.50% in 2022/23 and dropping to 5.34% in 2023/24 (Mid-April).
External Sector (Growth in Percent)
Export growth has been highly variable, from a peak of 44.4% in 2020/21 to negative growth of -3.7% in 2023/24 (Mid-April). Import growth followed a similar trend, with substantial negative growth of -26.3% in 2022/23. The current account balance generally remained negative, indicating a deficit, peaking at -333.7 billion in 2020/21 but improving slightly to -179.5 billion in 2023/24 (Mid-April). Gross foreign exchange reserves remained healthy, peaking at USD 14364.1 million in 2023/24 (Mid-April).
Financial Sector (Growth and Interest Rate in Percent)
The growth in broad money (M2) and narrow money (M1) varied, with broad money peaking at 22.7% in 2020/21 and stabilizing around 12.3% in 2023/24 (Mid-April). Domestic credit showed high growth, especially in 2020/21 at 27.1%, but slowed down to 5.5% in 2023/24 (Mid-April). The 91-day T-bills rate reflected the monetary policy stance, peaking at 11.06% in 2022/23 and slightly dropping to 9.73% in 2023/24 (Mid-April). The base rate peaked at 10.33% in 2023/24 (Mid-April), reflecting the cost of funds for banks.
Public Finance (Growth and Ratio in Percent)
Revenue growth fluctuated, with a significant drop to -13.4% in 2022/23 but recovering to 9.4% in 2023/24SS. Expenditure growth also showed variations, with notable increases and decreases, ending at -3.6% in 2023/24SS. Both domestic debt and external debt increased, with domestic debt reaching NPR 1175.6 billion and external debt reaching NPR 1170.3 billion in 2023/24SS. The revenue/GDP and expenditure/GDP ratios indicate that the government's spending consistently outpaced its revenue collection.

