By Sandeep Chaudhary
Nepal Bank Credit and Deposit Ratio Analysis 2025: NPL, CD Ratio, and Financial Health
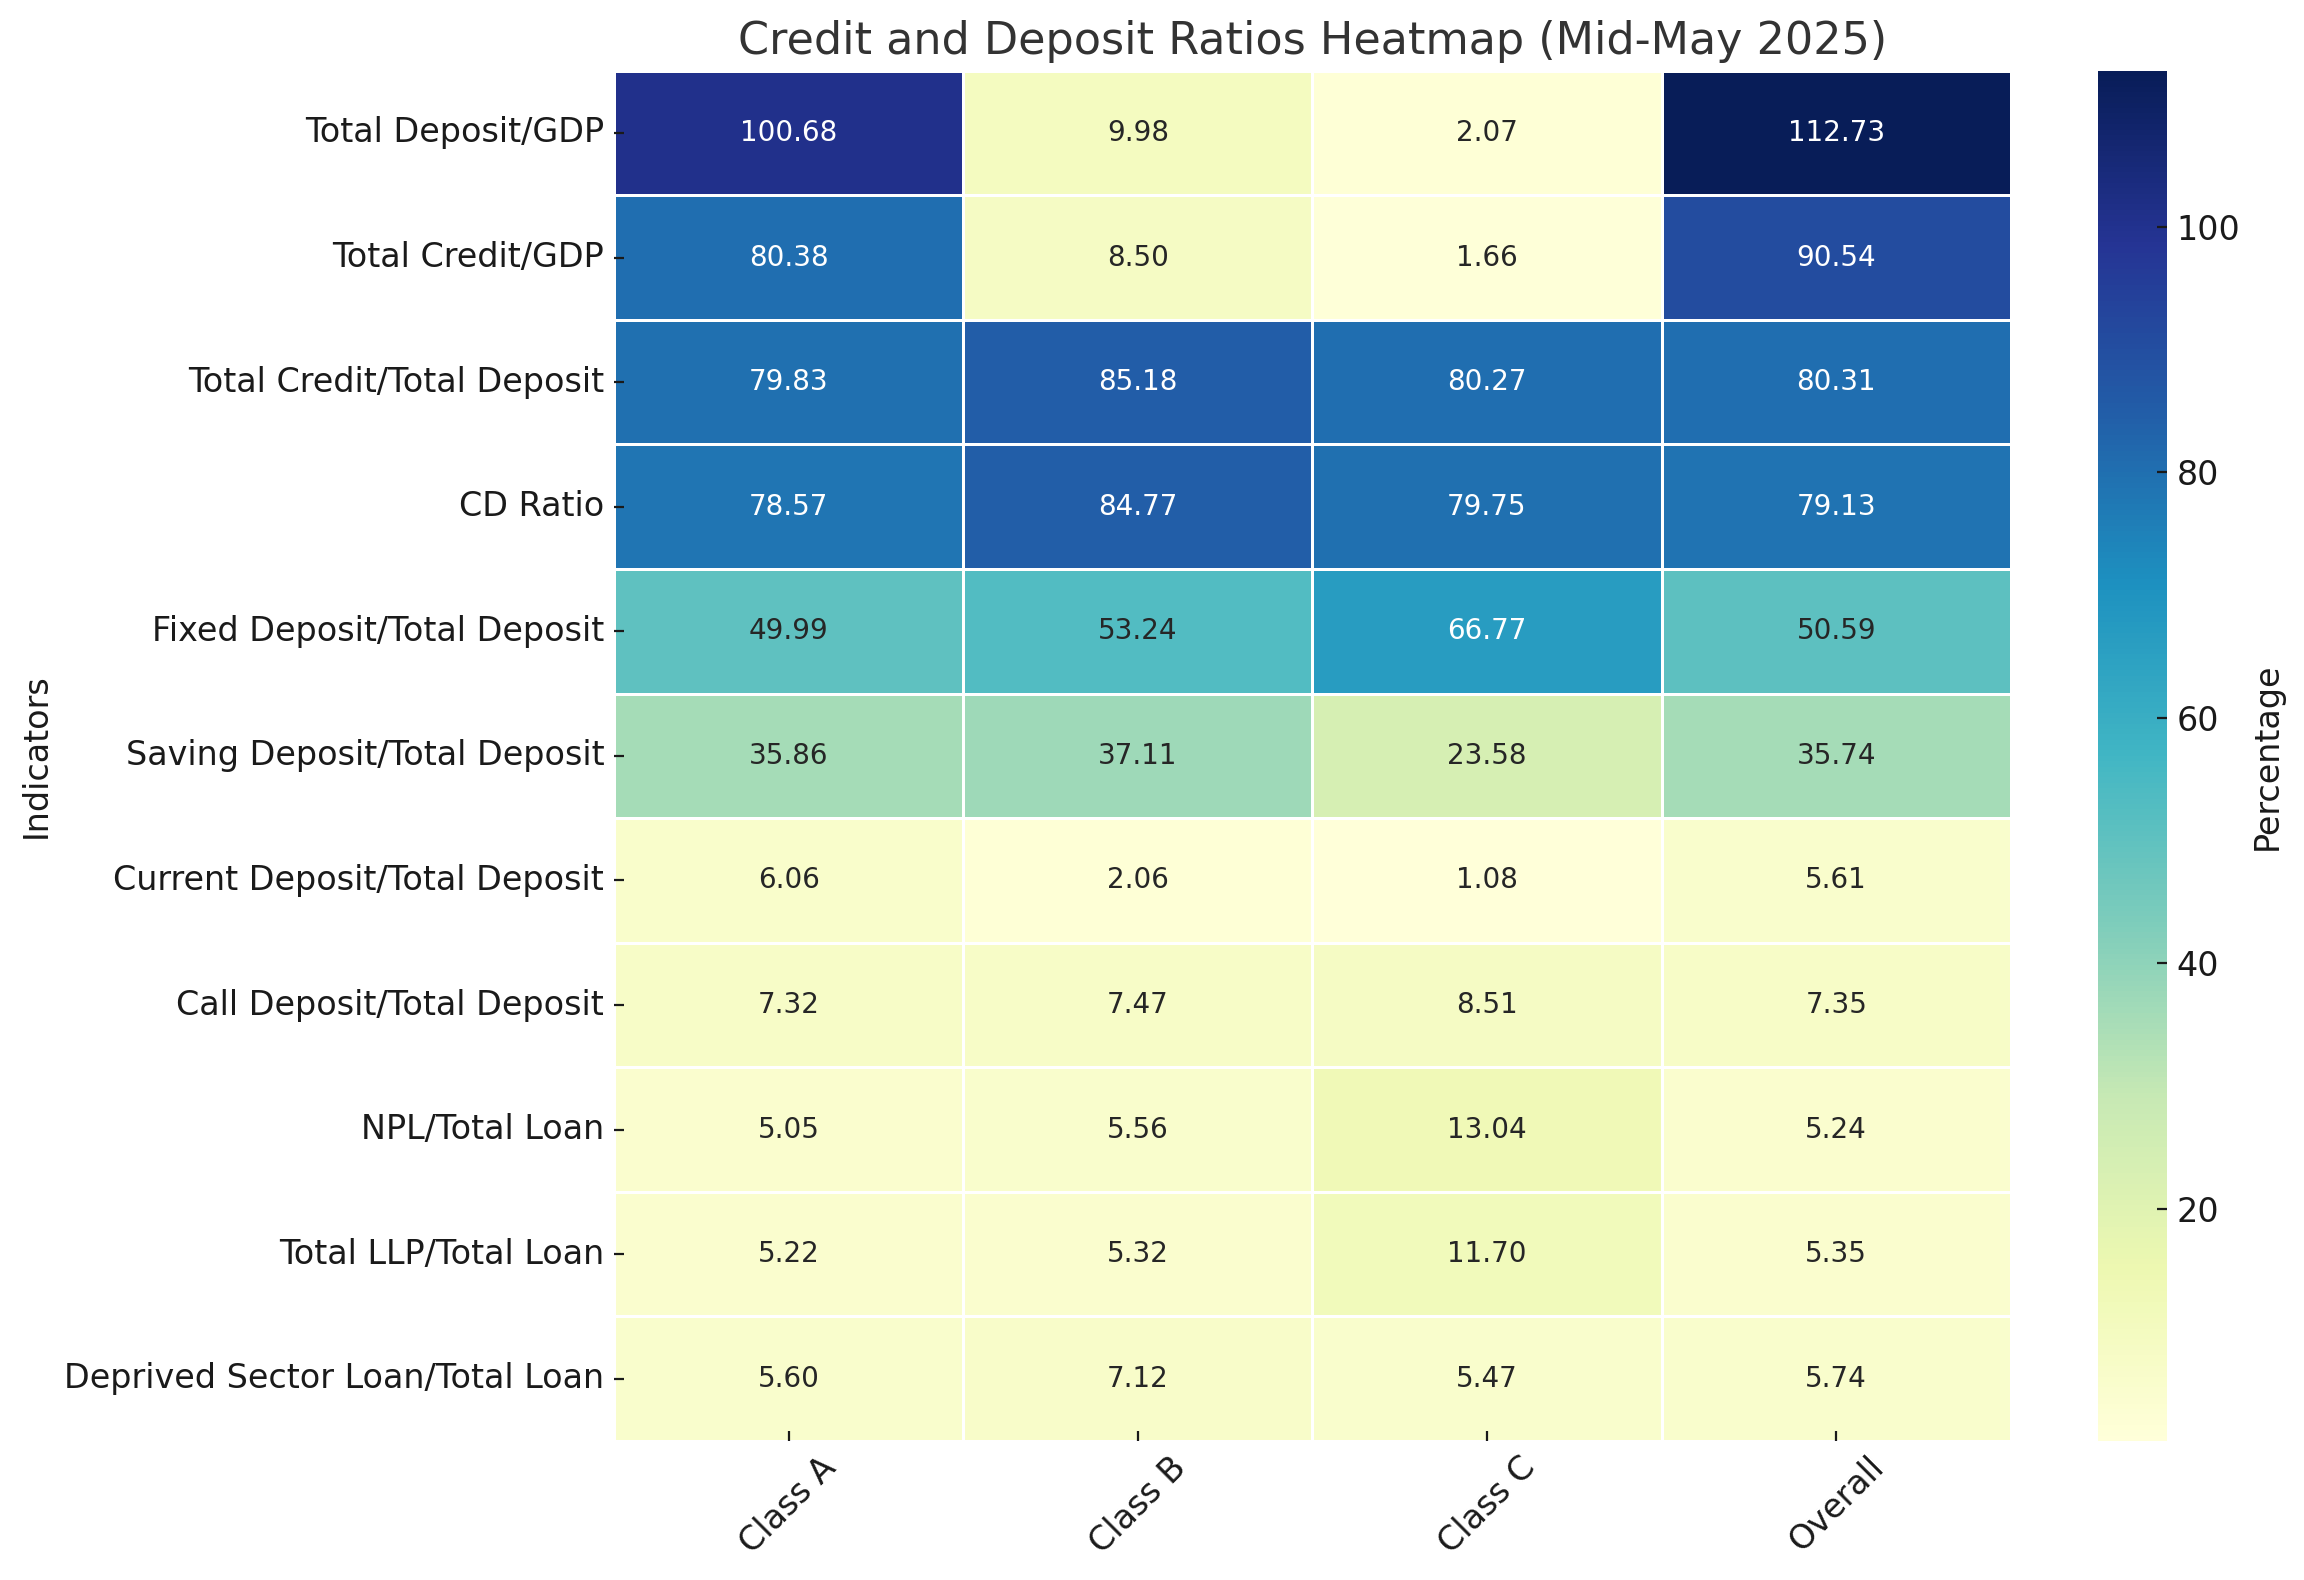
According to the latest financial data published for Baisakh End, 2082 (Mid-May 2025), Nepal’s banking and financial institutions (BFIs) have shown a mixed but stable performance across credit and deposit indicators. The overall Total Deposit to GDP ratio stood at a robust 112.73%, indicating strong public trust in the banking system. Class “A” commercial banks dominated with 100.68%, while Class “B” and “C” institutions contributed modestly at 9.98% and 2.07%, respectively.
In terms of lending activity, the Total Credit to GDP ratio reached 90.54% overall, led again by Class “A” banks at 80.38%. This suggests that commercial banks continue to be the primary credit providers in the economy. The Total Credit to Total Deposit ratio, a measure of liquidity risk, averaged 80.31%, showing a fairly balanced credit expansion, with Class “B” banks slightly higher at 85.18%, suggesting a more aggressive lending stance relative to deposits.
The CD Ratio (Credit + Core Deposits) across the sector stood at 79.13%, with Class “B” institutions again leading at 84.77%. This reflects relatively higher credit exposure among development banks.
Deposit composition shows that Fixed Deposits comprised over half of total deposits (50.59%), with Class “C” banks heavily reliant on them (66.77%), followed by Class “B” (53.24%) and Class “A” (49.99%). In contrast, Saving Deposits made up 35.74%, heavily dominated by Class “A” and “B” banks. Current and Call Deposits were relatively small components at 5.61% and 7.35%, respectively.
On asset quality, the overall Non-Performing Loan (NPL) ratio was 5.24%, with Class “C” institutions showing alarmingly high NPLs at 13.04%, suggesting risk management issues at the finance company level. The Loan Loss Provision (LLP) to Total Loan ratio stood at 5.35%, with Class “C” companies again showing a high provisioning level of 11.70%, indicative of stress in their loan portfolios.
Finally, the share of Deprived Sector Loans, which are mandated to support financial inclusion, was 5.74% of total loans, with Class “B” banks leading at 7.12%.
Overall, the data reflects a stable but segmented financial landscape where commercial banks dominate both deposit mobilization and credit disbursement, while smaller institutions face higher risk exposure. The figures emphasize the need for tighter risk control and better asset quality management, especially for non-Class "A" institutions.


