By Dipesh Ghimire
A Comprehensive Guide to Stop Loss and Target Locations in Trading: Insights on Managing Risk and Reward
In the world of trading, one of the most critical aspects of risk management involves setting appropriate stop loss and target locations. The use of stop loss orders helps mitigate losses when the market moves unfavorably, while target orders set a clear exit strategy for when a trade hits a desired profit level. The latest trading guide emphasizes different strategies for setting stop loss and target locations, particularly focusing on various chart patterns and their associated risk-reward setups.
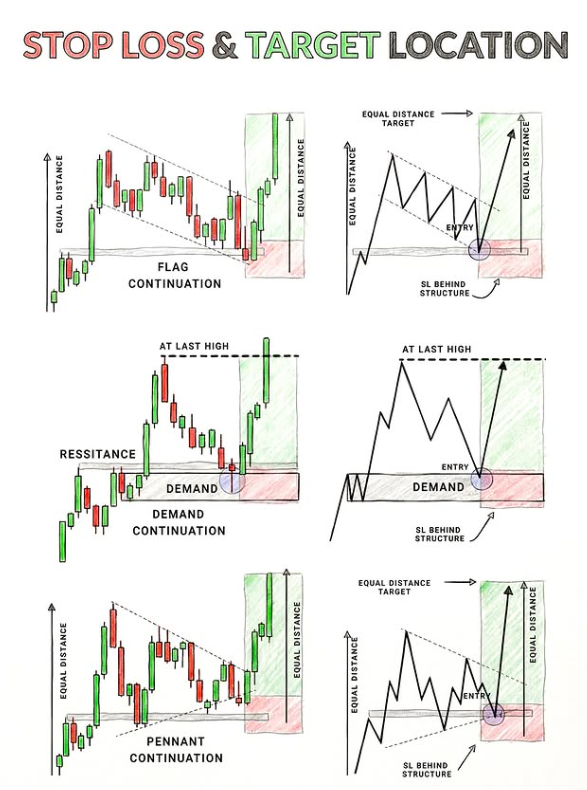
Flag Continuation: A Strategic Approach to Risk-Reward
One of the most common patterns traders use is the flag continuation pattern. This setup indicates a brief consolidation after a strong price move, followed by a continuation in the original trend.
Target Location: Traders often place the target at an equal distance from the breakout point. This means the distance from the breakout to the flagpole (the strong initial price move) is mirrored after the breakout, suggesting where the price might reach after the consolidation phase.
Stop Loss Location: The stop loss is generally set behind the structure, meaning just below the consolidation area. This is a safe position to protect against sudden reversals.
The flag continuation setup works well for traders looking to capitalize on strong trends with relatively lower risk, as the consolidation period often smooths out volatility.
Resistance and Demand Continuation: Utilizing Support and Resistance Levels
Another common approach in setting stop loss and target is based on demand continuation and resistance levels.
Resistance and Demand Zones: These are crucial areas where price tends to reverse, either due to an excess of supply (resistance) or demand (support). When the price breaks through these levels, it is often an indication of a continuation.
Target Location: Traders often set targets by measuring the distance from the demand zone to the breakout level, expecting the price to move an equal distance in the direction of the breakout.
Stop Loss Location: For this setup, stop losses are typically placed behind the resistance level or demand zone, depending on the breakout direction. This gives the trade room to breathe but also ensures that risk is minimized if the market turns against the trader.
This strategy is particularly effective for breakout traders who rely on the assumption that once a key level is breached, the price is likely to continue in that direction.
Pennant Continuation: Predicting the Next Move
The pennant continuation pattern, characterized by small symmetrical triangles forming during a price consolidation, suggests that a breakout is imminent. This pattern often occurs after a strong price movement, followed by a short period of consolidation, resembling a flag.
Target Location: Similar to the flag continuation, traders place the target at an equal distance from the flagpole, aiming for a price target that mirrors the initial price movement.
Stop Loss Location: The stop loss for this pattern is generally placed behind the consolidation structure, just outside the pennant pattern, offering protection from false breakouts while allowing for significant room for the trade to develop.
The pennant continuation setup is particularly effective in trending markets, providing traders with high-probability opportunities when price moves out of consolidation.
Key Insights for Traders:
Equal Distance Strategy: Whether it's a flag, pennant, or demand continuation pattern, the equal distance strategy is a common method for predicting price targets. By measuring the initial move and applying the same distance after the breakout, traders create a clear, calculated path for where they expect the price to reach.
Stop Loss Behind Structure: A common theme in the chart setups is placing the stop loss behind the structure, which provides protection if the market moves in the opposite direction. This placement ensures that the stop loss is only hit if there is a significant market reversal, thereby reducing the risk of being stopped out by normal market fluctuations.
Trend Continuation: Most of these strategies are designed for trend continuation—once a strong trend has been established, these setups anticipate that the market will continue in the same direction after a brief consolidation. Traders who rely on this strategy typically aim for moderate risk with high reward, based on the assumption that the prevailing trend will persist.
Mastering Risk Management for Successful Trades
Understanding where to place stop losses and set targets is essential for successful trading. By using chart patterns like flags, pennants, and demand levels, traders can strategically position their stop losses behind key structures and set targets based on equal distance from the initial price move. These setups provide a balance of risk and reward, helping traders stay on track during both bullish and bearish market conditions.
For traders, the key takeaway is to embrace these methodologies as part of a comprehensive trading plan, adjusting each strategy based on market conditions and individual risk tolerance. With these tools in hand, traders can improve their decision-making process and enhance their overall trading performance.