By Dipesh Ghimire
Understanding Types of Divergence in Trading: A Guide to Key Indicators
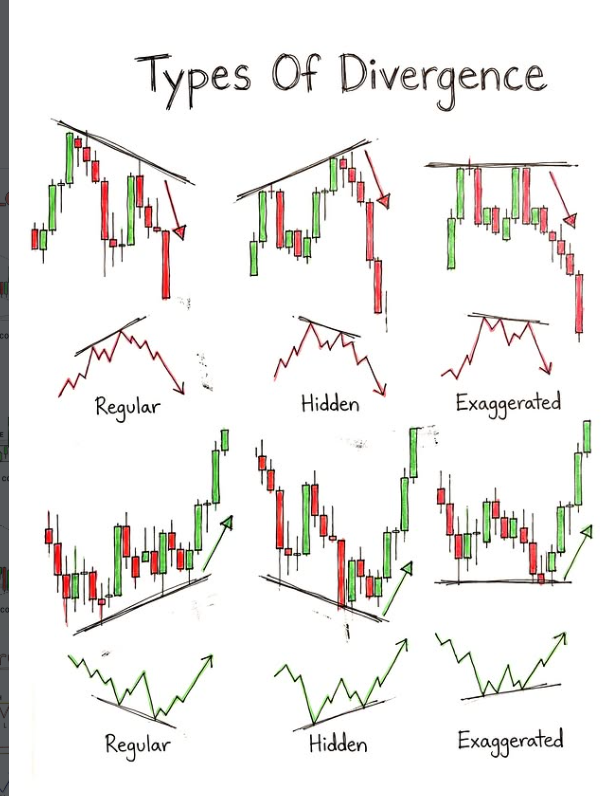
Divergence is a critical concept in technical analysis, widely used by traders to predict potential reversals or continuations in price trends. Divergence occurs when the price of an asset moves in the opposite direction of an indicator, typically a momentum oscillator like the Relative Strength Index (RSI) or Moving Average Convergence Divergence (MACD). The different types of divergence—Regular, Hidden, and Exaggerated—offer distinct insights into market behavior, helping traders make informed decisions based on the relationship between price movements and technical indicators.
1. Regular Divergence: A Sign of Reversal
The most commonly used type of divergence is Regular Divergence, which typically signals a potential reversal in the price trend. It occurs when the price forms a higher high or lower low, but the momentum indicator forms a lower high or higher low, respectively. This divergence indicates weakening momentum, often suggesting that the prevailing trend may be losing steam and a reversal is imminent.
Bullish Regular Divergence: When the price forms lower lows, but the momentum indicator forms higher lows, it suggests that the selling pressure is weakening, and a reversal to the upside could be expected. Traders often look for long positions when this divergence appears during a downtrend.
Bearish Regular Divergence: On the other hand, if the price forms higher highs while the indicator forms lower highs, it signals that buying momentum is fading, and a downward price movement could follow. Traders tend to look for short positions in such cases during an uptrend.
2. Hidden Divergence: A Signal of Continuation
While regular divergence suggests a potential trend reversal, Hidden Divergence is used to identify continuation patterns. It occurs when the price forms a higher low or lower high, but the momentum indicator forms a lower low or higher high, respectively. This type of divergence suggests that the underlying trend remains strong and is likely to continue.
Bullish Hidden Divergence: When the price forms a higher low but the indicator forms a lower low, it signals that despite a temporary pullback, the uptrend is likely to resume. Traders often look for buying opportunities in such cases during an established uptrend.
Bearish Hidden Divergence: Conversely, when the price forms a lower high and the momentum indicator forms a higher high, it suggests that the uptrend may be running out of steam, and a continuation of the downtrend is expected. Traders may look for selling opportunities when this divergence occurs in a strong downtrend.
3. Exaggerated Divergence: An Extreme Indicator
Exaggerated Divergence is a more extreme form of divergence that occurs when the price and the indicator show dramatic differences in their movements. This type of divergence can signal an extreme shift in market sentiment and is often used to identify potential market exhaustion or extreme volatility.
Bullish Exaggerated Divergence: When the price forms significantly lower lows while the momentum indicator makes a sharp higher low, it suggests that selling pressure is overdone, and a sharp reversal to the upside is possible. This often occurs when the market is oversold and could lead to a strong bullish rally.
Bearish Exaggerated Divergence: Similarly, if the price forms much higher highs while the momentum indicator forms lower highs, it suggests that the bullish trend may have reached an extreme point, and a reversal to the downside is more likely. This is often seen when the market becomes overbought, and a sharp sell-off may follow.
Practical Applications for Traders
Each type of divergence offers distinct information about market conditions and potential price movements. Traders use these signals to refine their entry and exit strategies:
Regular Divergence: Ideal for identifying reversal points. Traders often use this divergence in conjunction with other technical indicators, such as support and resistance levels, to confirm the signal before entering a trade.
Hidden Divergence: Best used for traders looking to capitalize on trend continuation. This type of divergence is particularly useful when the price is in a strong uptrend or downtrend, and the trader wants to enter in alignment with the dominant trend.
Exaggerated Divergence: A powerful signal for detecting extreme market conditions, often used for entering trades at potential turning points, especially after significant overextensions in price action.
Conclusion: A Comprehensive Tool for Market Analysis
In conclusion, understanding the different types of divergence—Regular, Hidden, and Exaggerated—is essential for traders looking to enhance their market analysis. These divergences provide valuable insights into the strength of price trends and potential reversal or continuation points. By recognizing the signals from momentum indicators and understanding their implications, traders can better navigate the complexities of the market, improving their decision-making and optimizing their trading strategies.
As the market evolves, the ability to correctly interpret these divergences becomes a vital skill for technical traders, helping them stay ahead of price movements and increase their chances of success in both trending and consolidating markets.