By Dipesh Ghimire
Bearish Sell Trap Explained: How Smart Money Outsmarts Retail Traders
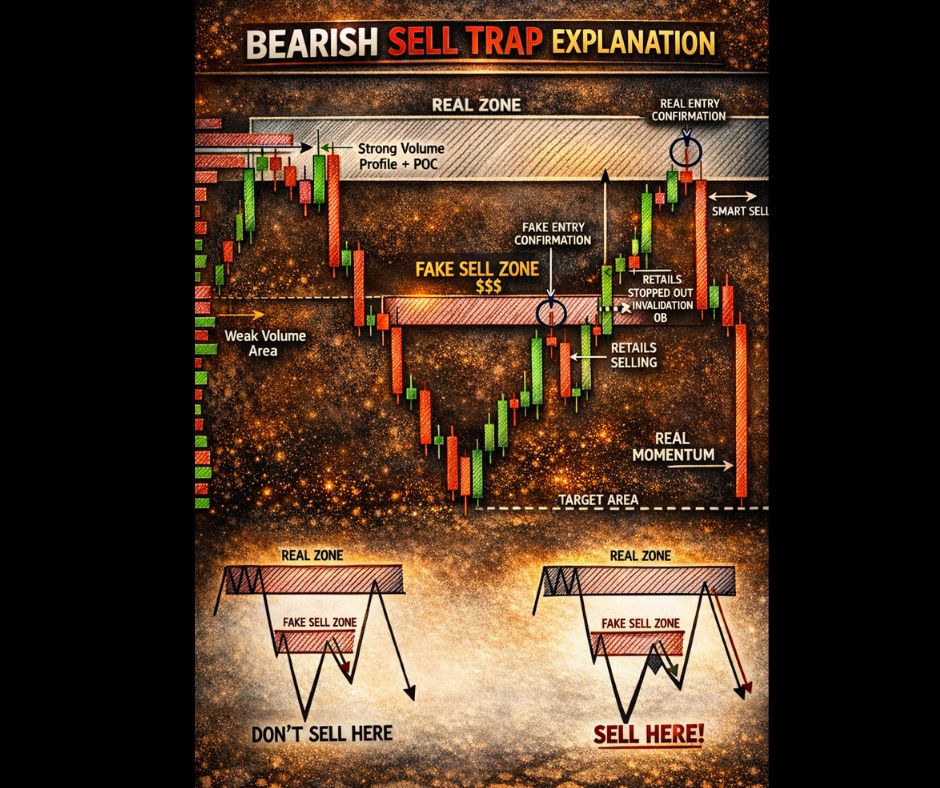
A detailed trading illustration titled “Bearish Sell Trap Explanation” is gaining widespread attention among technical analysts and retail investors for revealing how market manipulators and institutional players often trap inexperienced traders into losing positions. The chart visually explains how false breakdowns are created to mislead sellers before the real market move begins.

At the start of the diagram, price is shown moving within a Real Zone, an area marked by strong volume profile and Point of Control (POC). This zone represents where large institutions accumulate and distribute positions. High trading volume in this area indicates strong interest from professional market participants.
As price begins to decline from this zone, it enters a Weak Volume Area, where liquidity is low and price can move quickly. This initial drop creates fear among retail traders, leading many to believe that a strong downtrend has started.
The chart then highlights the Fake Sell Zone, labeled as “$$$,” where most retail traders initiate short positions. At this stage, a Fake Entry Confirmation appears, such as a minor breakdown or bearish candlestick pattern. These signals convince inexperienced traders that selling is the correct decision.
However, instead of continuing downward, price reverses sharply upward. This move is labeled as Retail Stop-Out Invalidation, showing how stop-loss orders placed by retail traders are triggered. Institutions use this liquidity to enter large buy positions at favorable prices.
Following this stop-hunt, the market enters the Real Zone again, where a Real Entry Confirmation occurs. This is where professional traders initiate their actual selling positions, often after price fails to hold above resistance and shows clear weakness.
The diagram marks this phase as Smart Sell, emphasizing that institutional traders wait for confirmation rather than reacting emotionally. After this, strong Real Momentum develops, pushing price downward rapidly toward the Target Area.
The lower part of the image reinforces this lesson with simplified models labeled “Don’t Sell Here” and “Sell Here.” These sketches clearly show that selling inside the fake zone leads to losses, while waiting for confirmation inside the real zone provides higher-probability trades.
Volume analysis plays a crucial role throughout the chart. Strong volume in real zones indicates genuine participation, while weak volume in fake zones suggests manipulation and lack of conviction. This contrast helps experienced traders distinguish between real and false moves.
Overall, the illustration serves as a warning against emotional and impulsive trading. It demonstrates how markets are often engineered to exploit fear and impatience, particularly among new traders who rely solely on basic indicators and patterns.
As global participation in stock, forex, and cryptocurrency markets continues to expand, understanding concepts like sell traps, stop hunts, and smart money behavior is becoming increasingly important. The “Bearish Sell Trap” framework encourages traders to focus on structure, volume, and confirmation rather than chasing every apparent breakdown.
In today’s volatile environment, the message is clear: successful trading is not about reacting first, but about waiting for the right moment. Those who learn to identify traps can protect their capital, improve consistency, and trade alongside institutional flows rather than against them.


