Top
Latest
Popular
NEPSE Trading
Stock
Trading
Dipesh Ghimire
·By Dipesh Ghimire
By Dipesh Ghimire
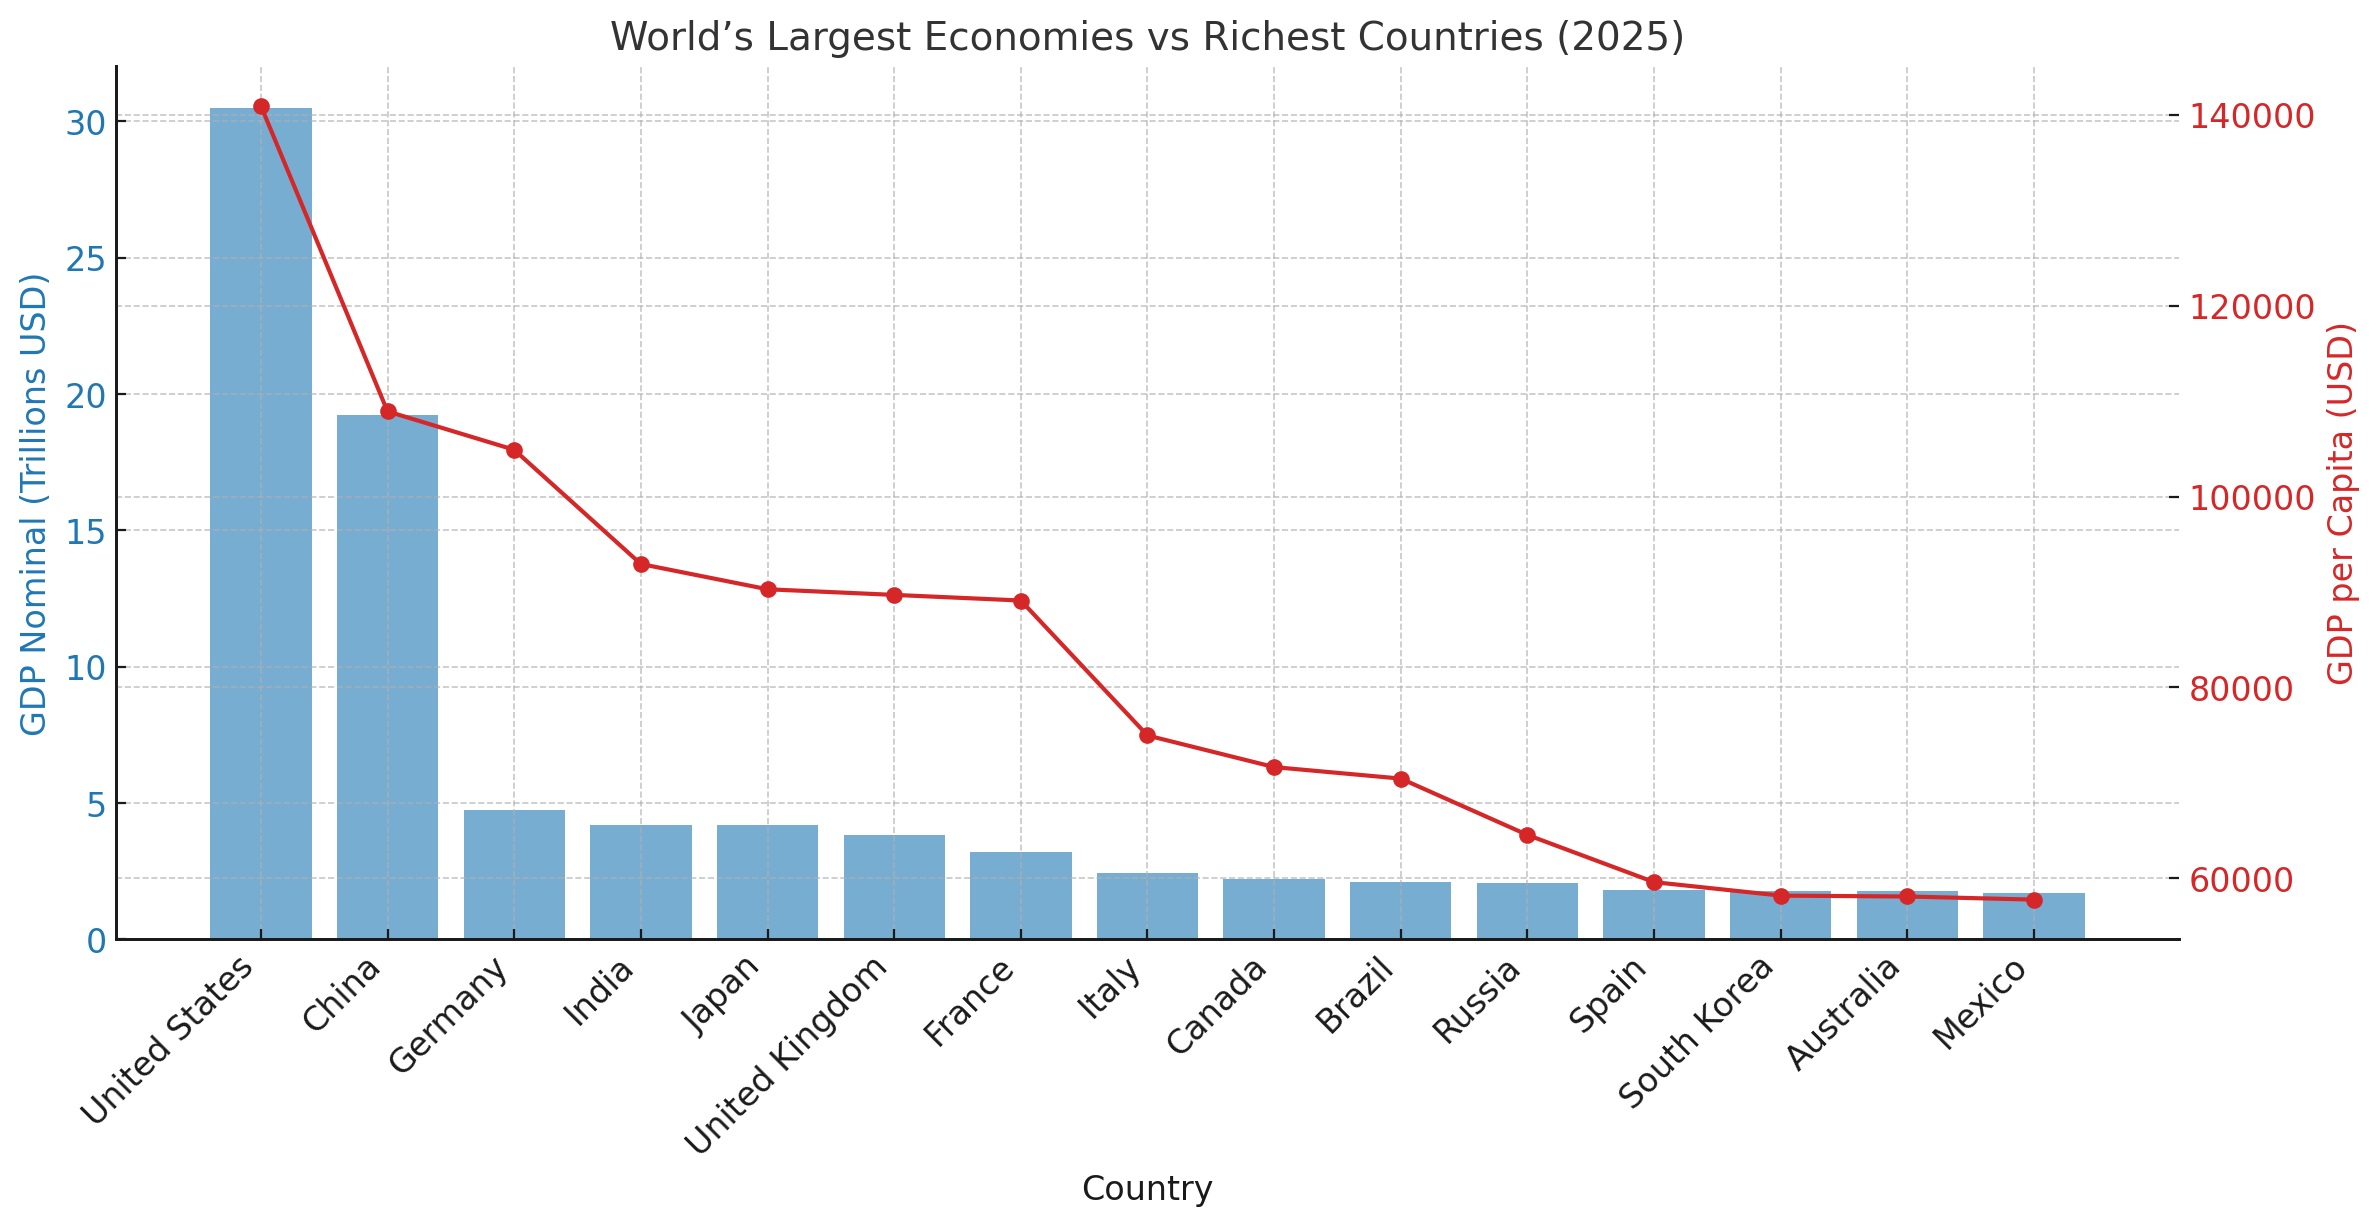
The 2025 global economic landscape reveals a sharp contrast between economic scale (nominal GDP) and prosperity (GDP per capita). While countries like the United States, China, and India dominate in total output, they are often outpaced in per capita wealth by smaller, high-income nations like Luxembourg, Ireland, and Switzerland. These differences aren't just numerical—they highlight divergent economic models, population sizes, sectoral strengths, and national policies.
This report breaks down and interprets the top 15 countries by both nominal GDP and GDP per capita, helping investors, policymakers, and analysts understand what these rankings actually mean.

Rank | Country | GDP Nominal (USD T) |
|---|---|---|
1 | United States | $30.51 |
2 | China | $19.23 |
3 | Germany | $4.74 |
4 | India | $4.187 |
5 | Japan | $4.186 |
6 | United Kingdom | $3.84 |
7 | France | $3.21 |
8 | Italy | $2.42 |
9 | Canada | $2.22 |
10 | Brazil | $2.12 |
11 | Russia | $2.07 |
12 | Spain | $1.80 |
13 | South Korea | $1.79 |
14 | Australia | $1.77 |
15 | Mexico | $1.69 |
United States dominates globally, with a GDP bigger than the combined total of the next three countries.
China, although second, is catching up fast due to its vast manufacturing and export base.
India edges past Japan for the first time, symbolizing its economic ascent, despite lower per capita income.
European powers like Germany, UK, and France remain major players, but their growth is slower compared to Asian economies.
Emerging markets like Brazil, Mexico, and Russia remain in the top 15 but face challenges like political instability and commodity dependency.
Rank | Country | GDP per Capita (USD) |
|---|---|---|
1 | Luxembourg | $140,941 |
2 | Ireland | $108,920 |
3 | Switzerland | $104,896 |
4 | Singapore | $92,932 |
5 | Iceland | $90,284 |
6 | Norway | $89,694 |
7 | United States | $89,105 |
8 | Denmark | $74,969 |
9 | Qatar | $71,653 |
10 | Netherlands | $70,450 |
11 | Australia | $64,548 |
12 | San Marino | $59,603 |
13 | Austria | $58,192 |
14 | Sweden | $58,100 |
15 | Belgium | $57,772 |
Luxembourg is again the richest country by GDP per capita, thanks to a small population and dominant financial services sector.
Ireland and Switzerland benefit from strong tech, pharma, and banking industries.
Singapore’s strategic location and status as a global trading hub make it Asia’s richest country per capita.
Scandinavian countries (Norway, Iceland, Denmark, Sweden) reflect balanced growth models, strong welfare systems, and high productivity.
The United States, while 1st in total GDP, ranks 7th in GDP per capita, indicating large wealth, but also economic disparity due to its massive population.
Australia is the only country to consistently appear high in both lists, reflecting strong natural resource exports and a developed economy.
The largest economies by GDP are not necessarily the wealthiest on a per-person basis. A large GDP can result from a large population rather than high productivity or high wages.
Luxembourg, Ireland, and Singapore show that with a well-managed economy, even small nations can outperform giants in per capita wealth.
India and China are economic giants in aggregate but their huge populations dilute per capita wealth. Countries like Australia and the Netherlands fare better in per capita rankings due to their smaller size.
Finance drives Luxembourg and Switzerland.
Tech and Pharma power Ireland and the U.S.
Oil and Gas support Qatar and Norway.
Manufacturing and Services propel China, India, and Germany.
In 2025, the global economy can be seen as two parallel narratives:
The powerhouses of production and population — like the U.S., China, India — dominate nominal GDP.
The elite, service-oriented, efficient economies — like Luxembourg, Ireland, Switzerland — top the wealth-per-person rankings.
For global investors and policymakers, this distinction is vital. High total GDP signals market size and productio
Dipesh Ghimire
·8 Apr, 2026


